


Bitcoin closes below its weekend low, NEAR falls 10.5%, and Sky sees a surge in spot trading. Five daily charts track BTC, ETH, NEAR, SKY and ZEC on Nov. 20.
| Asset | Latest USD price | Past 24 hours | Market-wide 24h volume | Market-cap rank |
|---|---|---|---|---|
| Bitcoin (BTC) | $62,009 | −2.14% | $34.68 billion | 1 |
| Ethereum (ETH) | $1,741.68 | −3.24% | $11.65 billion | 2 |
| NEAR Protocol (NEAR) | $3.04 | −10.51% | $549.75 million | 23 |
| Sky (SKY) | $0.04488113 | −8.69% | $119.88 million | 66 |
| Zcash (ZEC) | $861.81 | −6.99% | $779.45 million | 11 |
Bitcoin Breaks Sunday’s Low, then Rebounds Above $62,000
Bitcoin fell 1.70% on Thursday to close at $61,913.50, just $56.80 below Sunday’s low. That met the condition identified in Thursday’s Bitcoin analysis : a daily close below $61,970.30. On Wednesday, buyers kept the entire session above that level. On Thursday, Bitcoin fell to $61,353.20 and finished below the weekend floor.
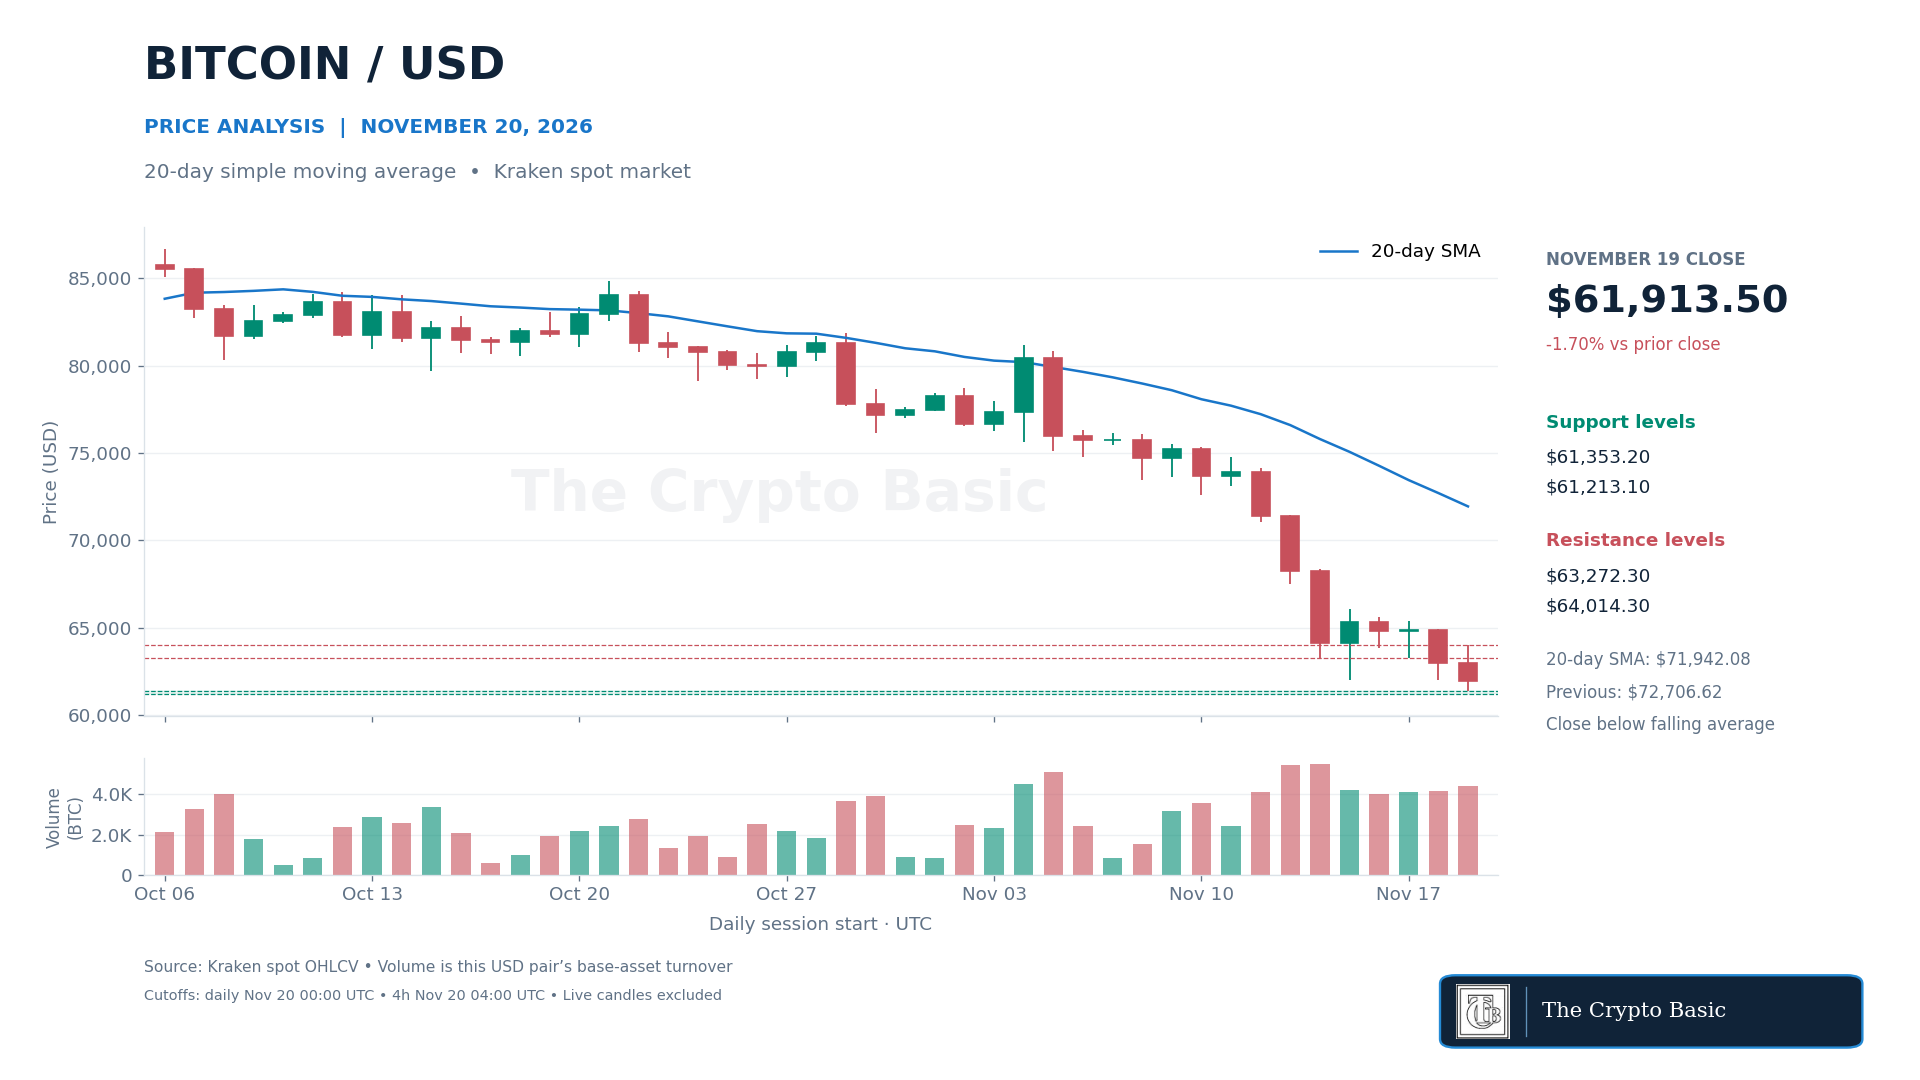
The 20-day simple moving average fell from $72,706.62 to $71,942.08, more than $10,000 above Thursday’s close. A nearer test is the sequence of lower daily highs: $65,378.70 on Tuesday, $64,928.10 on Wednesday and $64,014.30 on Thursday. Buyers have an opportunity to interrupt that sequence well before they reach the average.
Friday’s first four hours showed why the closing price matters. Bitcoin dipped to $61,213.10 but recovered to $62,089.60 by 04:00 UTC. A daily close above $61,970.30 would reclaim the weekend floor. Regaining Tuesday’s $63,272.30 low and then closing above $64,014.30 would do more to reverse the week’s damage. A daily close below $61,353.20 would confirm a further break, with Friday’s $61,213.10 low the nearest support.
Ethereum Holds $1,710 as Rebound Highs Keep Falling
Ethereum lost 1.10% on Thursday to close at $1,755.29. Its $1,734.23–$1,815.52 range sat entirely inside Wednesday’s range. Friday’s first four hours took ETH down to $1,721.93 before it recovered to $1,744.07. Sellers broke Wednesday’s $1,730.92 low intraday but did not reach Sunday’s $1,710 low. ETH traded at $1,741.68 at the cutoff, down from $1,807.68 in Wednesday’s Ethereum analysis .
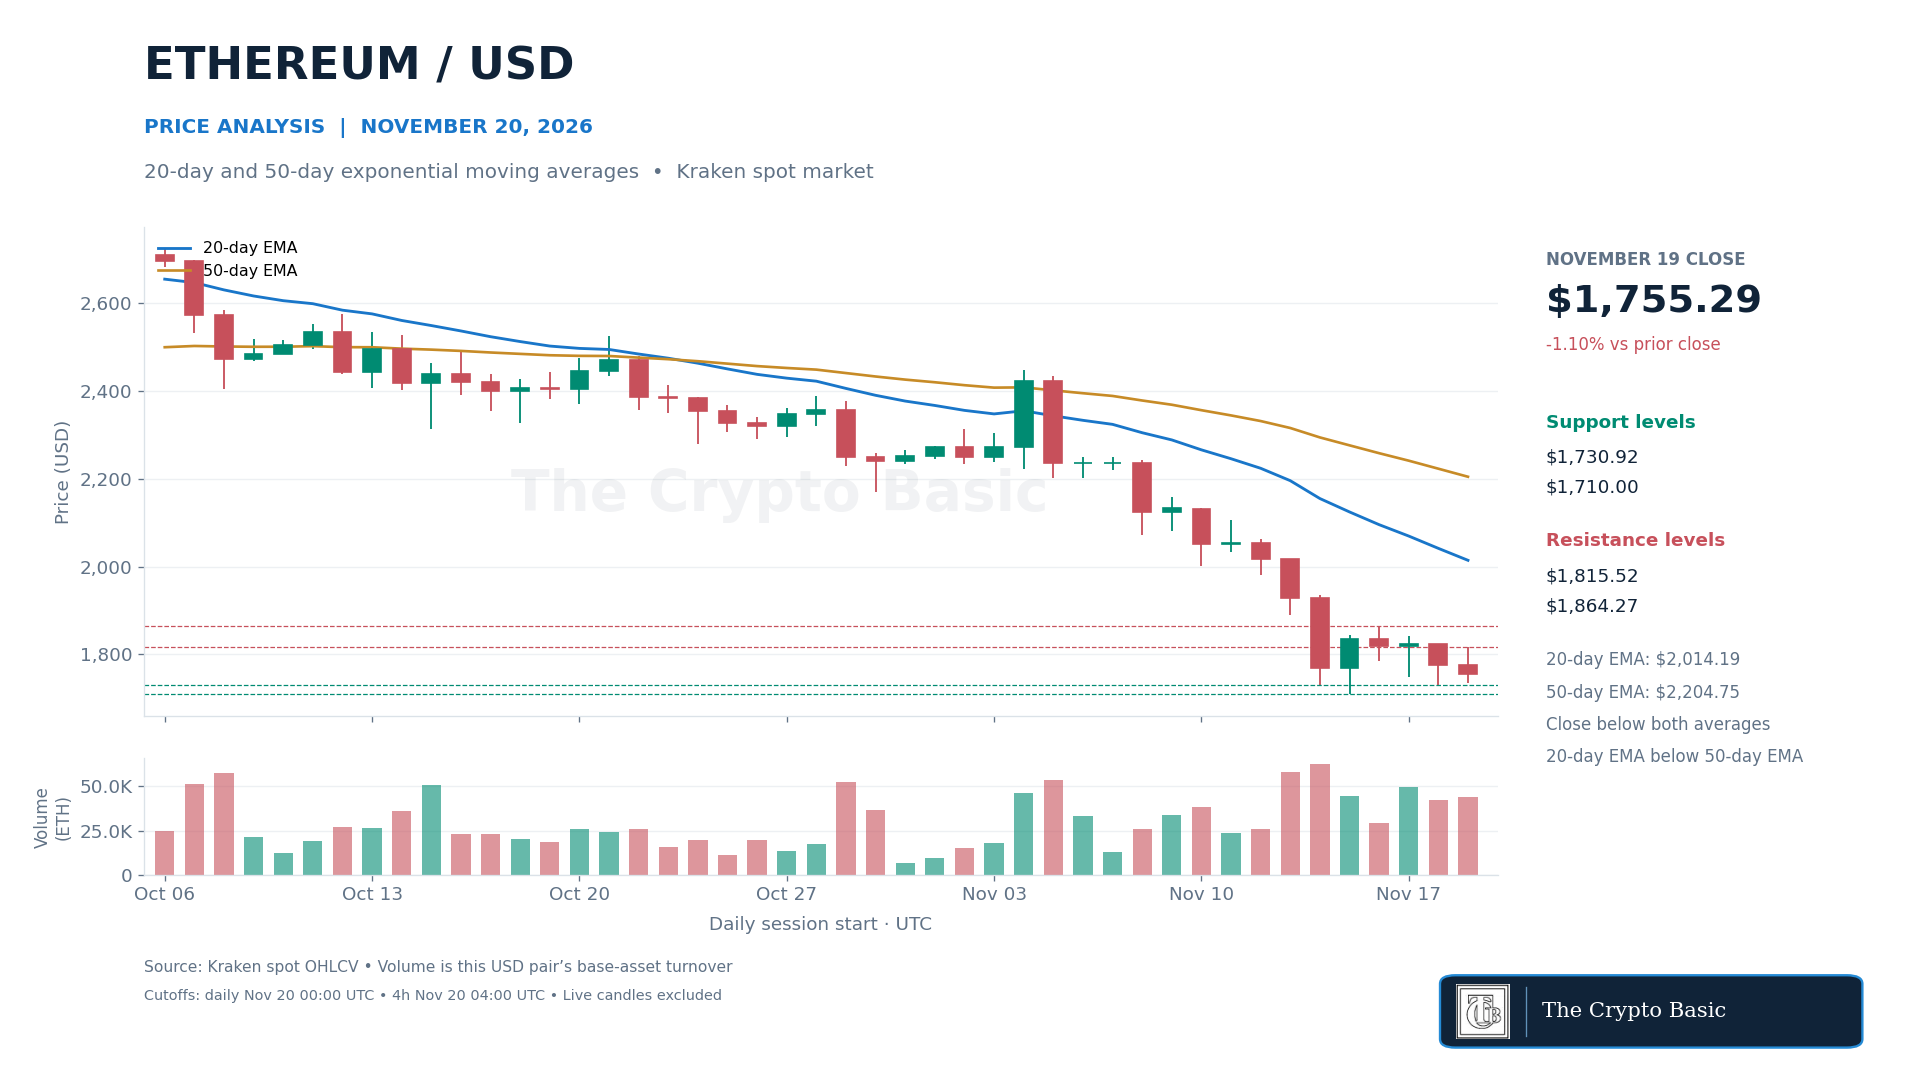
The 20-day exponential moving average fell to $2,014.19, and the 50-day average fell to $2,204.75. Both remained well above price. On the four-hour chart, the 20-period exponential average stood at $1,792.55. Even on that shorter timeframe, ETH’s recovery stopped below the average and short of Thursday’s high.
A daily close above $1,815.52 would clear the nearest lower high. Clearing Monday’s $1,864.27 high at the close would overturn the sequence dating from the start of the week. On the downside, a daily finish below $1,730.92 would confirm the break that Friday’s first four-hour candle failed to hold. Below $1,710, the weekend rebound would lose its base.
NEAR Gives Up $3.15 After Buyers Fail to Hold $3.47
NEAR reached $3.4745 on Thursday, above Wednesday’s $3.4248 peak and just above Saturday’s $3.4702 high. By the close, it had fallen to $3.2035, down 3.02%. Buyers pushed through two recent highs in one session but held neither.
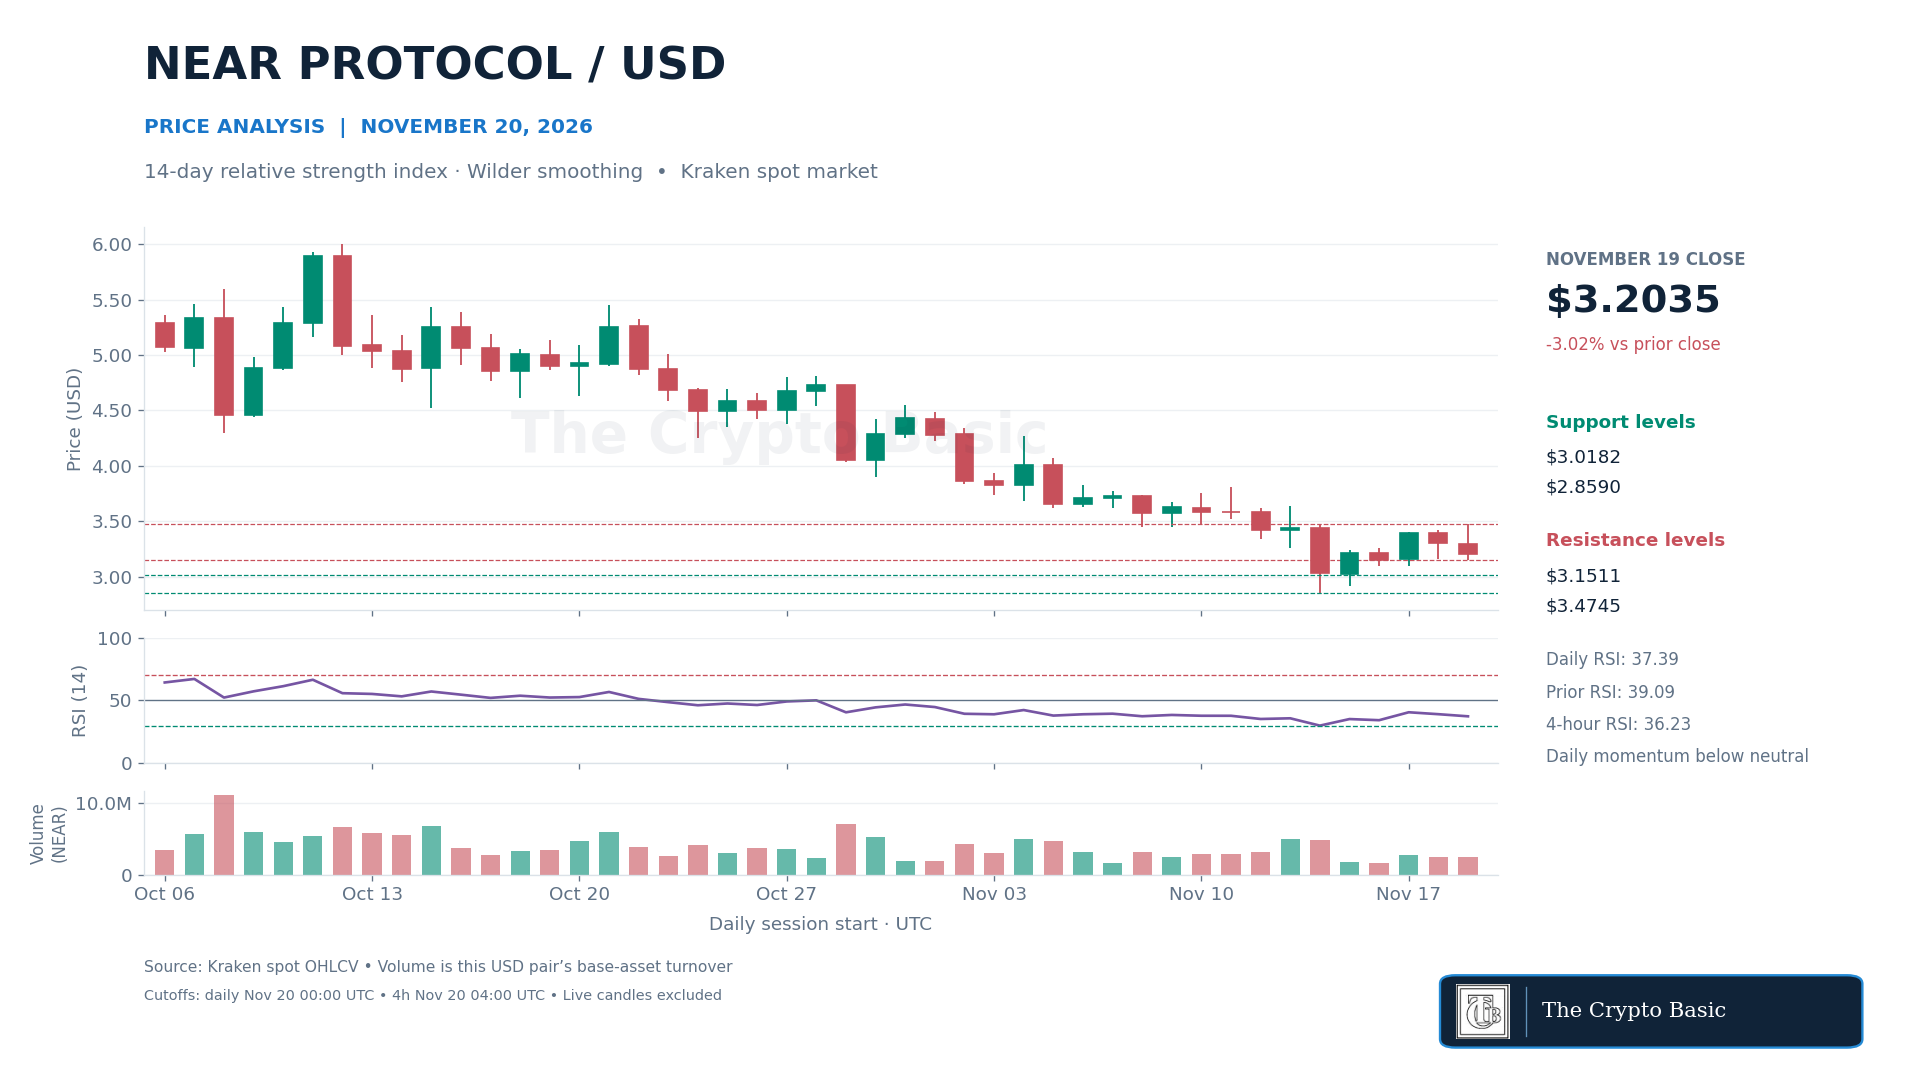
The 14-day relative strength index, calculated with Wilder smoothing, slipped from 39.09 to 37.39. It remained below the neutral 50 level but above the conventional oversold threshold of 30. The four-hour reading was slightly weaker at 36.23. Price supplied the clearer signal: Friday’s first four-hour candle closed at $3.0469, below Thursday’s $3.1511 low, after touching $3.0182.
That turns $3.1511 from support into the first recovery test. A daily close back above it would show that sellers could not hold the early break. Closing above $3.4745 would reverse Thursday’s failed advance. A daily close below $3.0182 would instead leave Sunday’s $2.9154 low and Saturday’s $2.859 low as the next supports. Friday’s daily session had not confirmed that move at the cutoff.
Sky’s USD Spot Volume Hits 24.46 Times its Recent Average
Sky traded as low as $0.03683 on Thursday before recovering to $0.04675. Buyers absorbed much of the intraday decline, but Sky still ended the day down 7.30%, below Wednesday’s $0.04976 low. At the other end of the range, Thursday’s $0.05046 high barely exceeded Wednesday’s $0.05043 close.
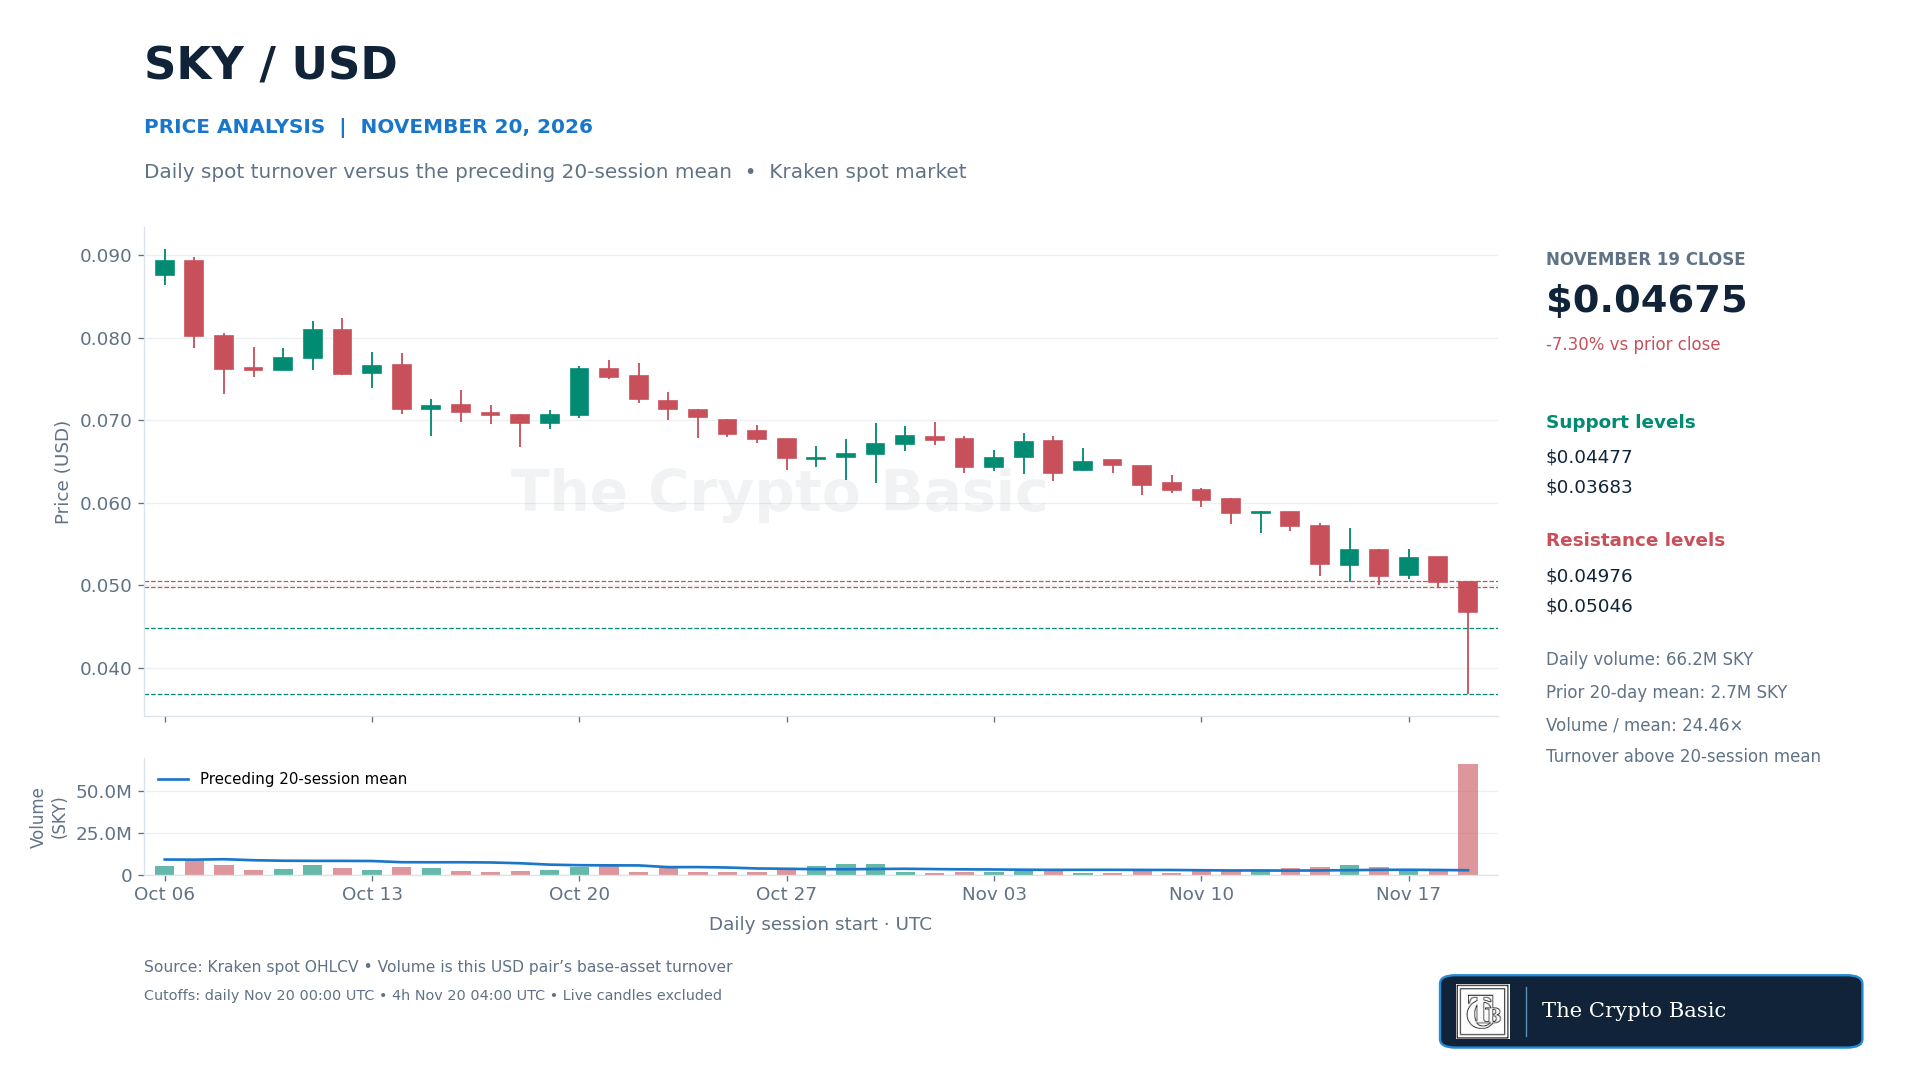
About 66.20 million SKY changed hands on the USD spot pair, against an average of 2.71 million over the preceding 20 completed sessions. That is 24.46 times the recent average. The surge accompanied both the plunge and the rebound. Total volume cannot establish how much buying took place at the low; the close below Wednesday’s support shows what buyers had yet to recover.
Friday’s first four-hour candle fell to $0.04477 and closed at $0.04494, giving back part of Thursday’s rebound. A daily close above $0.04976 would recover Wednesday’s floor. Above $0.05046, buyers would also clear the high of the unusually busy session. A daily finish below $0.04477 would weaken the rebound, while a close below $0.03683 would erase it.
Zcash Falls Below $900 While its Daily Lower Band Moves Away
Zcash closed at $893.68 on Thursday, down 2.01%. That gave back the rest of Tuesday’s advance from Monday’s $903.83 close. In Monday’s Zcash analysis , Sunday’s $931.21 high was the first upside test. Tuesday cleared it with a $966.96 close, but Wednesday and Thursday both finished back below it.
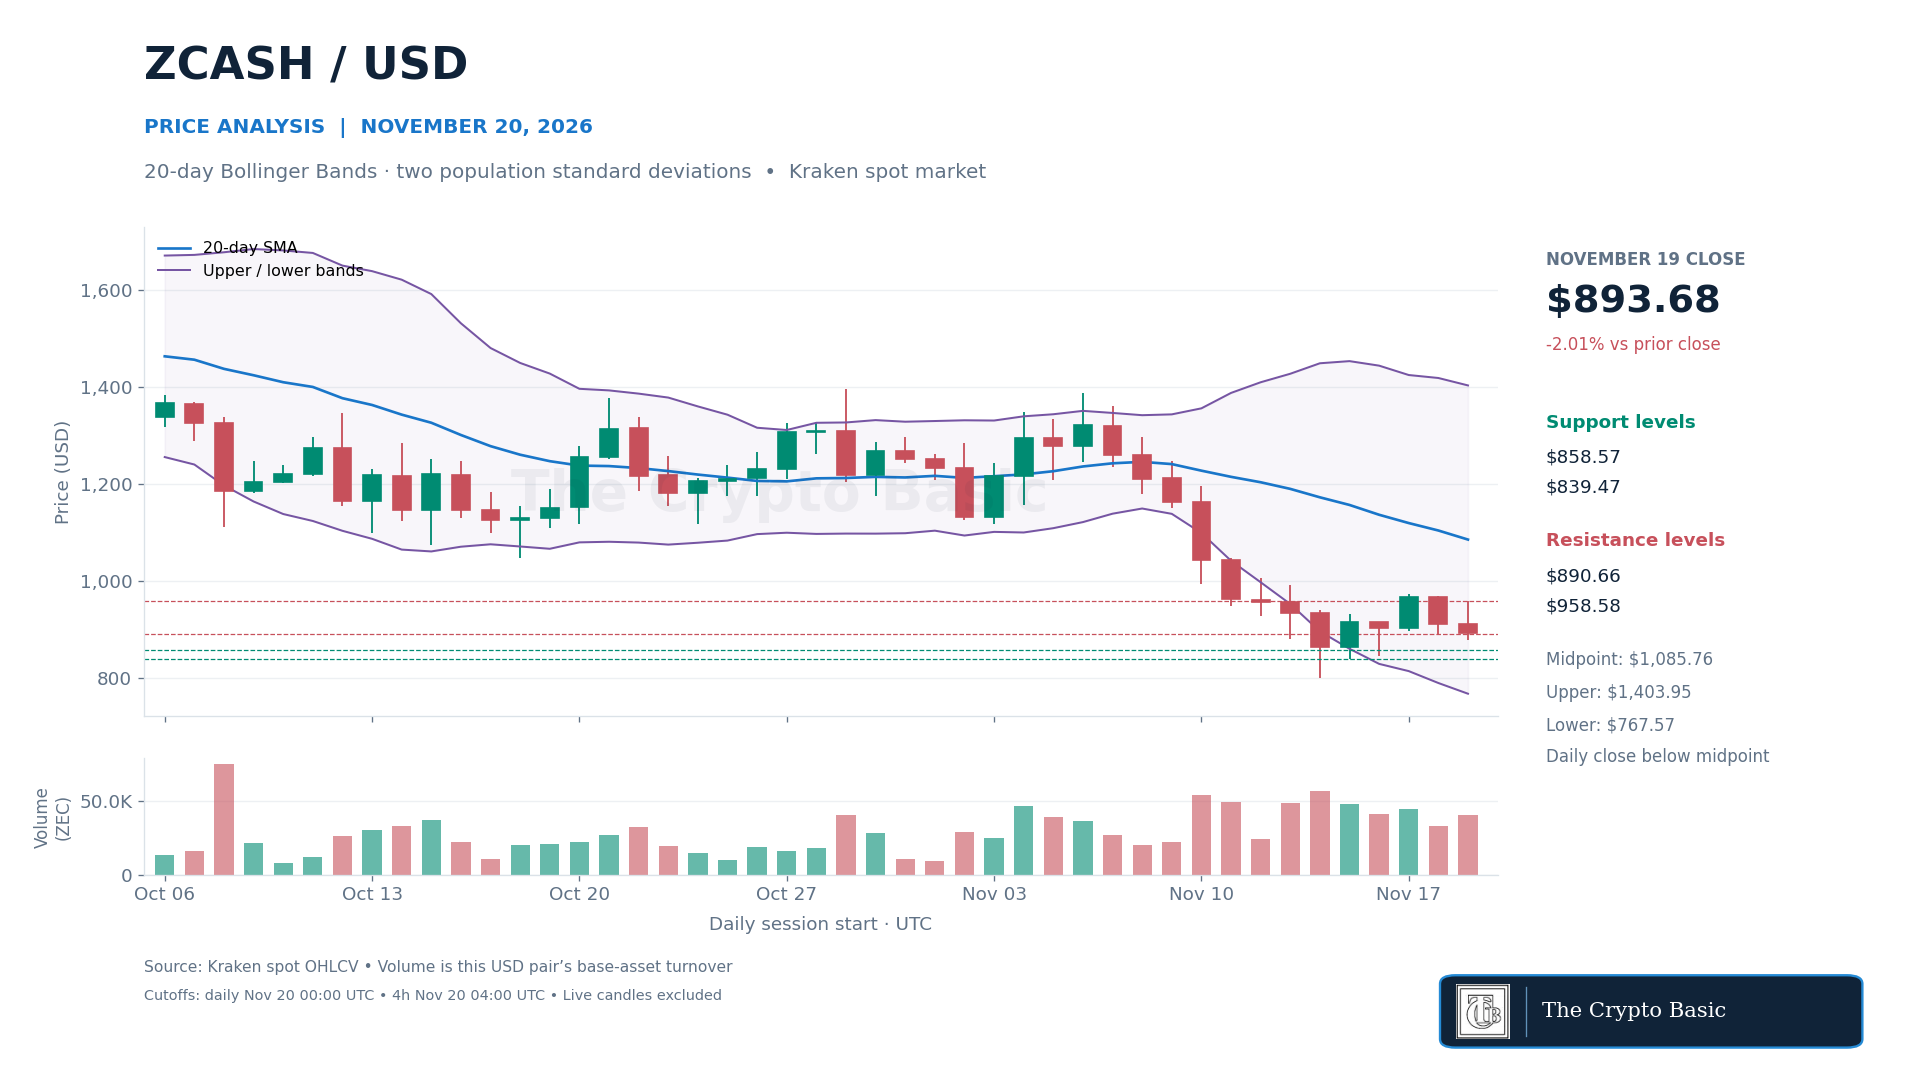
The daily Bollinger Bands show why the renewed decline did not produce a fresh break of the lower band. Using a 20-day simple average and two standard deviations, the midpoint fell to $1,085.76 and the lower band dropped from $789.67 to $767.57. Thursday’s $877.55 low was still nearly $110 above that boundary. The lower band moved farther away even as Zcash lost ground.
The four-hour chart showed more immediate pressure. Friday’s first candle closed at $865, beneath its $878.33 lower band, after reaching $858.57. A daily finish above Wednesday’s $890.66 low would recover the first level lost in early Friday trading; clearing Thursday’s $958.58 high would challenge the pullback. A daily close below $858.57 would expose Sunday’s $839.47 low, followed by Saturday’s $800.87. Both are nearer support levels than the daily lower band.