



XRP’s long-term chart resembles Amazon’s pattern before its 2009 breakout. Here’s how rising support, higher lows, and resistance compare.
XRP ‘s long-term price structure is showing a notable resemblance to Amazon’s stock chart before the company broke through decade-long resistance in 2009.
A comparison of both charts reveals similar patterns of rising support, repeated higher lows, and resistance that prevented sustained price advances for years.
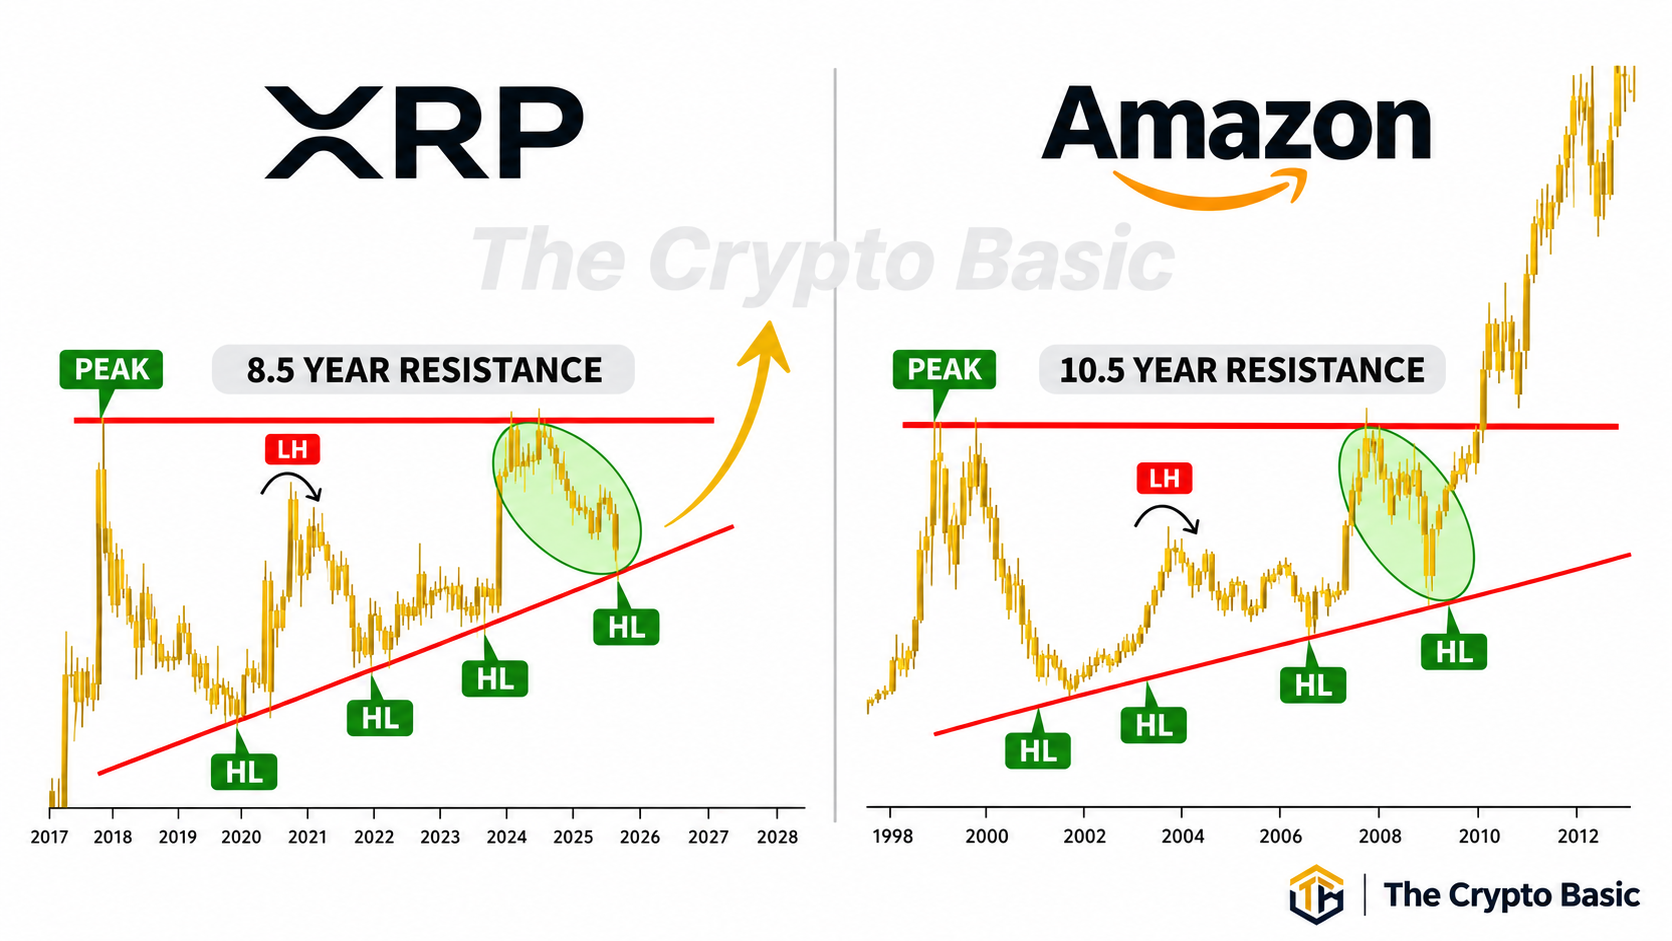
Amazon eventually broke above its resistance and entered a powerful rally. XRP, however, remains in the corrective phase of its comparable structure, with another potential support test still ahead.
Amazon Spent 10.5 Years Below Major Resistance Before Breaking Out
Amazon’s chart, covering approximately 1998 through 2012, illustrates how the stock consolidated for more than a decade before establishing a sustained breakout.
The first important development occurred in 1999, when Amazon reached a major peak during the dot-com boom. The stock subsequently collapsed as the technology bubble burst, eventually establishing a significant bottom in 2001.
A recovery followed, but Amazon failed to reclaim its previous peak, producing a lower high around 2003.
Despite struggling against overhead resistance, the stock gradually established a series of higher lows through the early and mid-2000s.
These lows formed an ascending support trendline, represented by the red diagonal line.
Amazon challenged its historical resistance again around 2007 but failed to sustain the advance. Another correction followed during the 2008 financial crisis.
This is where the green-highlighted section becomes important.
Rather than falling below its long-term ascending support, Amazon recovered from the trendline in early 2009.
The subsequent rally carried the stock above its previous historical resistance later that year, ending roughly a decade of consolidation. Amazon then extended its advance through 2010–2012, as illustrated on the chart’s right side.
XRP Shows a Similar Pattern Dating Back to 2018
XRP’s chart follows a comparable structure, although the pattern has not reached the same outcome.
The initial peak occurred in January 2018, when XRP reached approximately $3.84, according to CoinMarketCap.
Like Amazon, XRP subsequently experienced a prolonged correction.
The chart identifies a major bottom around 2020, followed by another recovery that produced a lower high near $1.96 in April 2021.
Meanwhile, XRP continued establishing higher lows through subsequent market cycles, including the 2022 and 2024 corrections.
These higher lows form the rising red support trendline beneath XRP’s price.
The next important development came in July 2025, when XRP surged to approximately $3.66, revisiting the historical resistance region established in 2018.
However, buyers failed to sustain the rally.
XRP subsequently entered another prolonged correction, with lower highs developing throughout 2026.
As The Crypto Basic previously documented , XRP’s ascending support previously accompanied major recoveries following its March 2020 and July 2024 lows.
Why the Green Circles Are Important for XRP
The green-highlighted areas represent the most significant similarities between both charts.
For Amazon, the highlighted section captures the final correction from resistance toward ascending support before the stock eventually broke out.
For XRP, the highlighted section covers its ongoing decline from the 2025 resistance test toward a possible support retest around late 2026 or early 2027.
Both formations show prices retreating from horizontal resistance toward an ascending trendline.
However, there is one crucial difference.
Amazon’s final higher low and subsequent breakout are completed historical developments. XRP’s corresponding higher low remains a potential future development.
The projected upward arrow on XRP’s chart illustrates what a recovery might resemble if support holds and buyers eventually overcome resistance. It does not represent an established breakout or a measured price target.
XRP Must Defend Long-Term Support Before Challenging Resistance
XRP currently trades around $0.98, leaving its immediate resistance at the psychological $1 level.
The recent November low near $0.89 provides an initial downside reference.
Below that, XRP’s broader ascending trendline becomes increasingly important.
A separate long-term technical assessment places potential support near $0.78 around the beginning of 2027, while other monthly readings identify a broader $0.70–$0.82 region.
A recovery from this area, followed by a confirmed higher low, would strengthen XRP’s resemblance to Amazon’s 2009 setup.
Conversely, repeated weekly closes beneath ascending support would damage the pattern.
Even a successful rebound would leave significant resistance overhead.
XRP must first recover intermediate price levels before returning to the broader $3.50–$3.84 resistance region.
As The Crypto Basic previously examined , XRP’s multi-year ascending triangle depends on rising support continuing to hold beneath historical resistance.
A sustained monthly breakout above the 2025 high near $3.66, followed by a move beyond the historical $3.84 peak, would provide stronger confirmation of a long-term structural change.
Amazon accomplished that transition in 2009. XRP has yet to do so.
The comparison remains technical rather than fundamental: Amazon’s historical appreciation reflected the growth of an operating business, while XRP’s valuation responds to different market forces.
XRP Price if XRP Replicates Amazon’s Historic Breakout Pattern
If XRP replicates Amazon’s historic breakout pattern shown in the comparison chart, XRP could reach approximately $8.98, with an extended scenario pointing to $13.78.
| Scenario | XRP Price |
|---|---|
| Resistance | 3.84 |
| 2012 analogue | 8.98 |
| 2013 analogue | 13.78 |
These are calculated historical analogues, not confirmed price targets.