




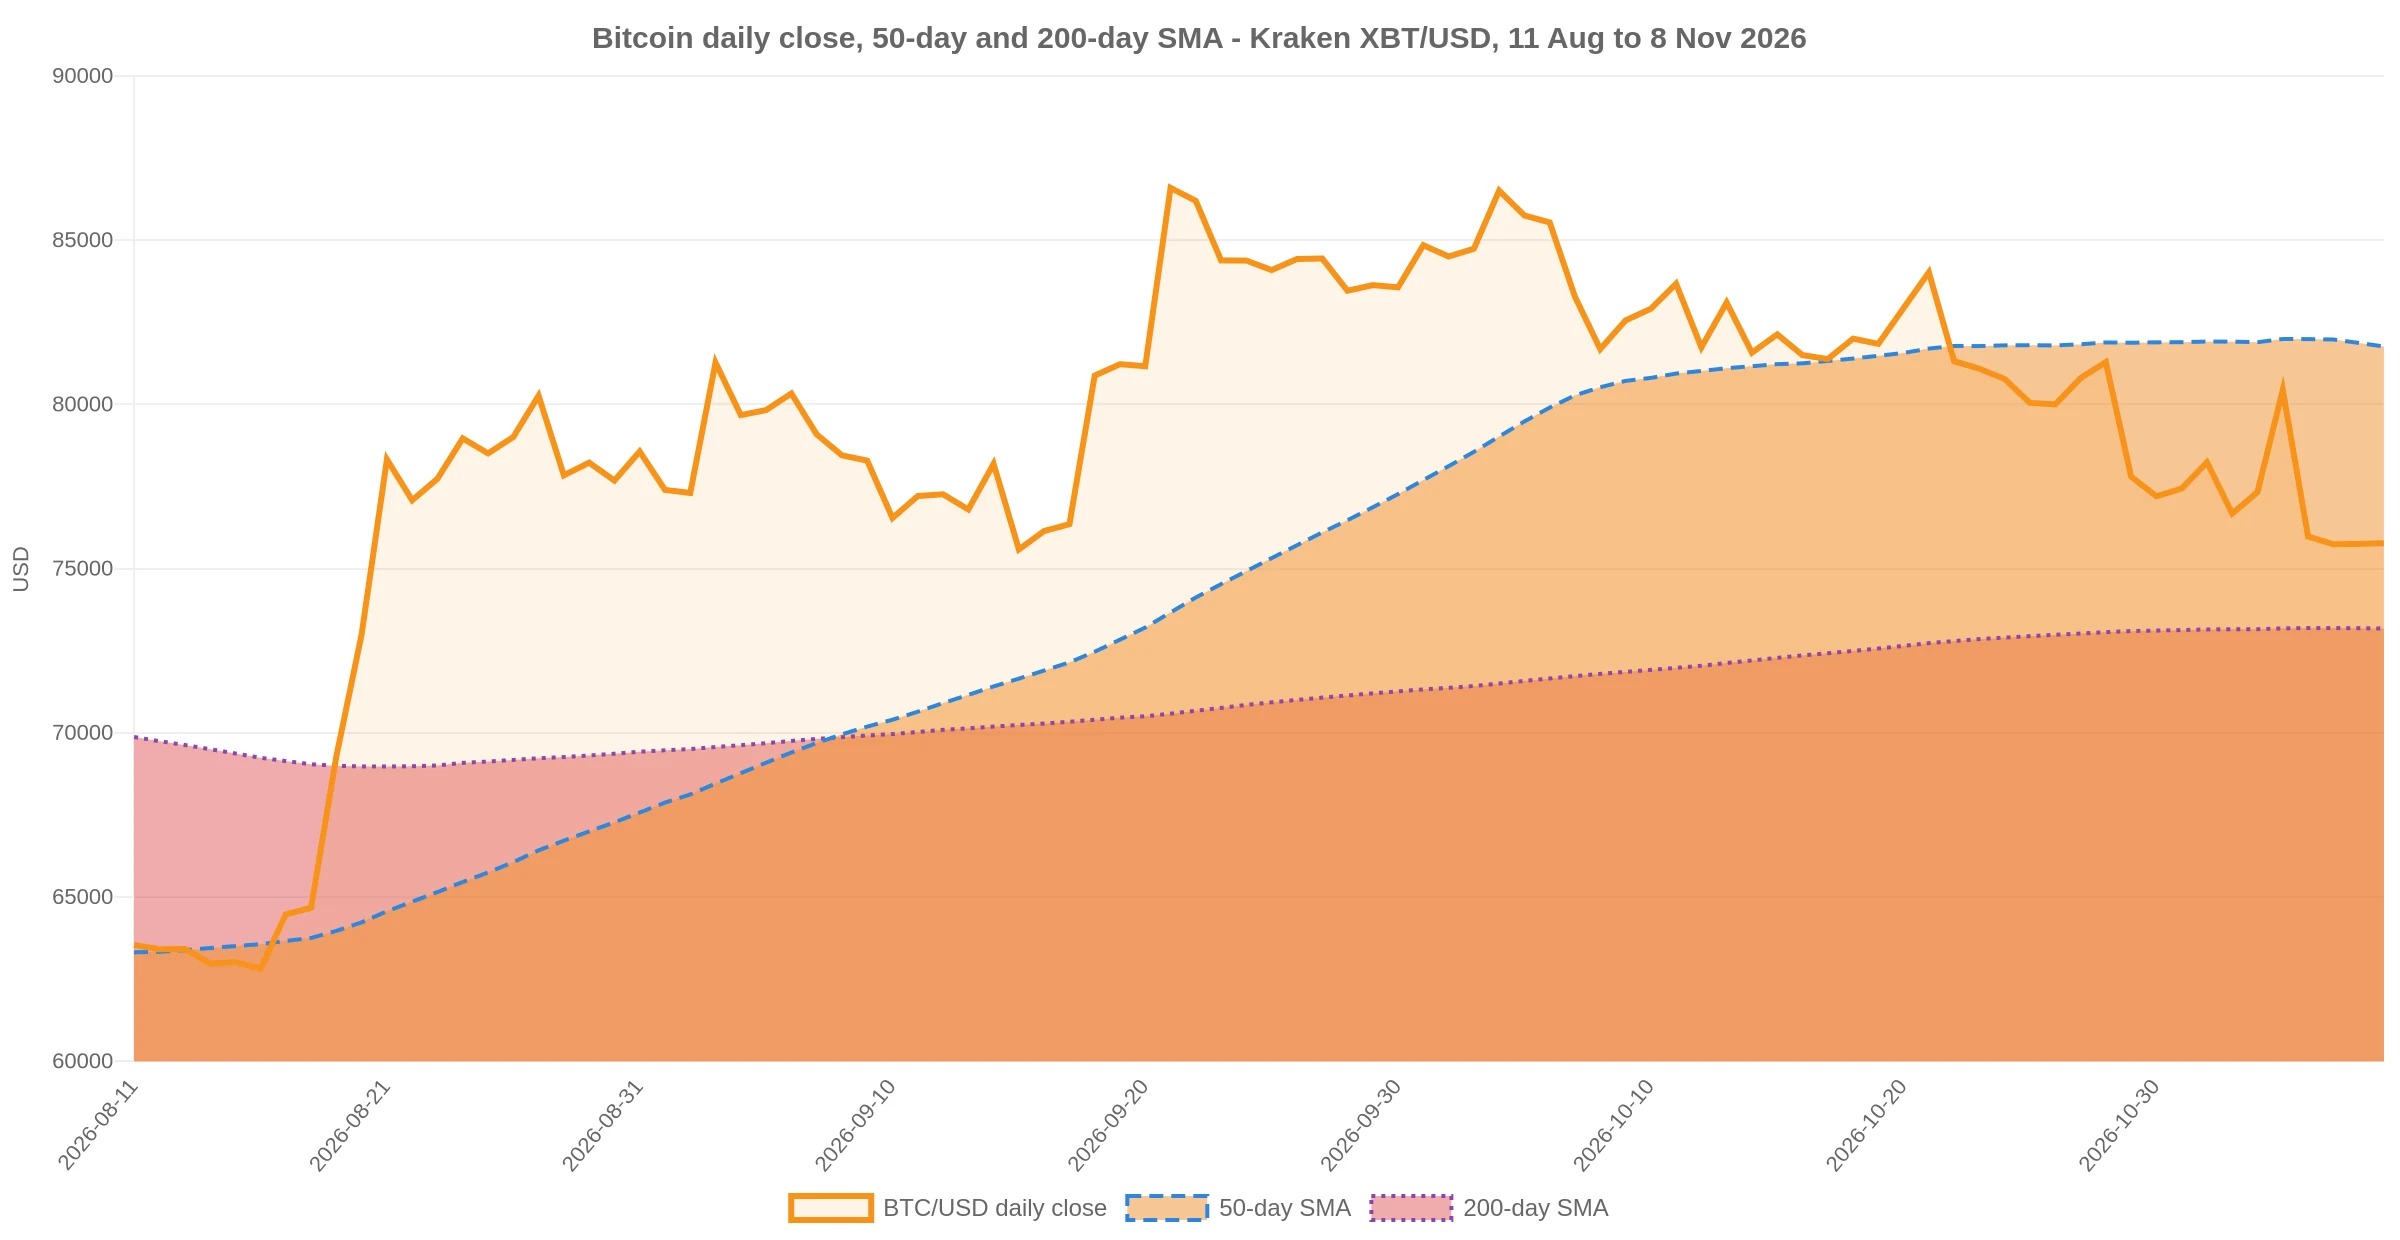
Bitcoin traded at $75,774.10 at 10:20 UTC on 8 November, down 3.15% on the week and 7.33% below its 50-day moving average of $81,765.43, according to Kraken’s daily XBT/USD OHLC feed . Coinbase printed $75,777.67 in the same minute on its public BTC-USD ticker . The two venues agree to within $3.57.
The 200-day average sits at $73,175.84, which is 3.55% below spot. That means bitcoin is not in a clean downtrend or a clean uptrend on the two averages that most systematic funds use. It is below the short one and above the long one, and the distance between them is the widest it has been all year.
That is the whole story of the price on 8 November. The dollar figure barely moved in four sessions. The structure around it moved a lot.
Five Weekly Closes Lower, and $216 Billion of Value With Them
Measured from each Sunday close to the next, bitcoin has now printed five consecutive lower weekly closes: -3.28% on 11 October, -2.00% on 18 October, -2.38% on 25 October, -2.26% on 1 November and -3.15% in the week that ends at midnight UTC tonight. The 8 November figure is a snapshot taken at 10:20 UTC, a little under fourteen hours before that close, so the fifth entry is provisional: more than half a day of trading remains. It is not provisional in direction: bitcoin would need to gain 3.25% between now and 00:00 UTC to turn the week green, and the last three daily changes came in at -0.31%, +0.02% and +0.03%.
| Week ending (Sunday) | BTC close | Change |
|---|---|---|
| 11 October 2026 | $83,675.60 | -3.28% |
| 18 October 2026 | $82,001.70 | -2.00% |
| 25 October 2026 | $80,048.50 | -2.38% |
| 1 November 2026 | $78,239.20 | -2.26% |
| 8 November 2026 (10:20 UTC) | $75,774.10 | -3.15% |
Compounded, the five weeks come to -12.41%. At the current circulating supply of 20,109,490 coins, that is $215.9 billion of notional value removed since the 4 October close of $86,510.40, calculated at constant supply so the figure isolates price rather than issuance.
Recovering it takes more than the drop. A return to the 4 October close needs a 14.17% gain from here. A return to the 21 September high of $87,446.70 needs 15.40%. Those are not forecasts; they are the arithmetic that any “back to where it was” claim has to clear.
Price Below the 50-Day, Above the 200-Day, and a Gap of 11.7%
The 50-day average crossed above the 200-day on 8 September, when the two sat at $69,955.69 and $69,868.01. That crossover came about a month after the 14 August low of $62,490 and it framed the September rally. Six weeks later the 50-day is still 11.74% above the 200-day, which means the medium-term trend has not broken, even though price has.
What has broken is the relationship between price and the short average. Bitcoin closed above its 50-day on 42 of the last 60 days. It has now closed below it for 18 consecutive sessions, the longest run since before the crossover. Reclaiming it needs a 7.91% move to $81,765.43, and that level is falling: it dropped $109 on 8 November and $102 the session before, as the September rally rolls out of the window.
The 200-day at $73,175.84 is the line that matters more, because it has not been tested since the crossover. A close below it would end the September structure and put the 14 August low back in play as the reference point. The 3.55% of cushion between spot and that average is thinner than the average daily range of the last 30 sessions, which is 2.62%.
From $62,490 to $87,447 and Back: the 90-Day Round Trip
The window from 11 August to 8 November contains the full round trip. Bitcoin bottomed at $62,490 intraday on 14 August, rallied 39.9% to $87,446.70 on 21 September, and has since given back 13.35% of that high. Spot is still 20.3% above the 14 August close of $62,979.40.
This matters for how the five-week slide should be read. It is a retracement inside a range that is still higher than it was in August, not a resumption of the August decline. The two statements are compatible with the same weekly chart, and the difference between them is the level, not the narrative.
Volatility has compressed alongside the slide. The average daily high-to-low range over the last 30 sessions is 2.62%, against 2.85% over 90 sessions. The last four closes sit inside a $238 band, from $75,741.60 to $75,979.90. Compression of that kind resolves; it does not persist.
What $1,000 Buys at $75,774
A $1,000 purchase at the Kraken close buys 0.013197 BTC. Doubling that position needs a price of $151,548.20. Tripling it needs $227,322.30. A tenfold outcome needs $757,741.00 per coin, which at the current supply is a $15.24 trillion market capitalisation.
For scale, the entire crypto market is worth $2.5336 trillion, per CoinGecko’s aggregate , with bitcoin’s dominance at 59.99%. A tenfold bitcoin is therefore six times the value of every other coin, token and stablecoin combined today. A $1 trillion valuation is the smaller milestone and sits at $49,727.77 per coin, 34.4% below spot.
Bitcoin’s market capitalisation is $1.5248 trillion at the CoinGecko print timestamped 10:22 UTC. It peaked at $126,080 on 6 October 2025, so spot is 39.86% below that record.
The Rest of the Board Is Down More
Bitcoin’s relative performance is the part of the data that argues against reading this as a bitcoin-specific event. Every large-cap asset in the comparison is weaker over 30 days except Tron, and all four alternatives are further from their records than bitcoin is.
| Asset | Price (USD) | 24h | 7d | 30d | From all-time high |
|---|---|---|---|---|---|
| Bitcoin (BTC) | $75,824 | -0.20% | -2.88% | -8.21% | -39.86% |
| Ethereum (ETH) | $2,233.50 | -0.50% | -1.58% | -10.69% | -54.84% |
| BNB | $696.78 | +0.35% | -2.08% | -6.16% | -49.14% |
| Tron (TRX) | $0.3203 | +0.28% | +3.05% | -3.52% | -25.74% |
| Zcash (ZEC) | $1,262.16 | -3.97% | +1.16% | +2.36% | -60.46% |
Tron is the only asset in the group that is positive on both the week and the year, at +3.05% and +9.57%. Zcash is the only one positive over 30 days, at +2.36%, though it is 3.97% lower today and 60.46% below its 2016 record. Bitcoin’s 59.99% dominance is what a week like this produces: capital leaves the edges first. The same divide has been running through the U.S. bid all autumn, as we showed in the 64-day Coinbase discount measurement, where the gap to offshore venues tracked a stablecoin basis rather than American selling.
Where the ETF Flows Fit, and Where They Do Not
Spot bitcoin ETFs recorded net redemptions in four of the five sessions through 6 November, summing to -$1,281.7 million, per Farside Investors . IBIT accounted for -$403.0 million on 6 November alone, while FBTC took in +$42.8 million the same day; the two sessions of 5 and 6 November shed $842.1 million, as we reported in Saturday’s flow breakdown . The prior week, 26 to 30 October, was a net inflow of $176.9 million.
That is a flow datapoint, not an explanation. In the week to 1 November, bitcoin fell 2.26% while the funds were net positive. A single week of redemptions alongside a single week of price decline is a coincidence of direction, and the dataset here cannot show which one moved first or whether either caused the other.
The Number That Settles It: Monday’s Close
Three observable things resolve the ambiguity in the next 48 hours. The first is the weekly close at 00:00 UTC on 9 November. A close above $78,239.20 would end the streak and invalidate the frame of this article. A close near spot extends it to five.
The second is the 200-day average at $73,175.84. It is the only remaining long-term reference above the August low, and a daily close below it changes what the five-week slide is.
The third is Monday’s ETF flow print, which arrives after the weekly close. If redemptions continue at the pace of 5 and 6 November, the cash and the price will be pointing the same way for a second week. If they reverse, the flow argument loses its evidence.
None of those three is a target. They are the conditions under which the current read stops being true.
Frequently Asked Questions
Bitcoin traded at $75,774.10 at 10:20 UTC on 8 November on Kraken, with Coinbase quoting $75,777.67 in the same minute. That is 7.33% below the 50-day average and 3.55% above the 200-day average.
Yes. The 200-day simple moving average is $73,175.84, which leaves 3.55% of room below spot. That cushion is smaller than the 2.62% average daily range of the last 30 sessions multiplied by two, so a single volatile day can close most of it.
From the 4 October close of $86,510.40 to $75,774.10 is -12.41%, which equals $215.9 billion of market value at the current supply of 20,109,490 coins. Recovering the loss needs a 14.17% gain, not 12.41%.
A weekly close above $78,239.20 at 00:00 UTC on 9 November would end it, which requires a 3.25% gain from the 10:20 UTC price. A daily close above the 50-day average at $81,765.43 would do more: it would restore the September structure and needs a 7.91% move.
Spot is 39.86% below the $126,080 record set on 6 October 2025, per CoinGecko. At the current supply, regaining that price would value bitcoin at $2.53 trillion, which is roughly the size of the entire crypto market today.
Data: Kraken , Coinbase , CoinGecko , Farside Investors .
This article is for information only and is not investment advice. Prices are timestamped and sourced as noted; market data changes after publication.