




Technical analysis crypto means reading price, volume, and chart structure to time entries and exits, rather than betting on a project’s roadmap. Use it when you need a repeatable process for deciding when to act, not when to decide whether an asset deserves your money in the first place.
Before opening a chart, run this checklist:
- Structure: Is price above or below the last major swing high/low?
- Momentum: Do RSI and MACD agree with the trend direction?
- Confirmation: Is volume or on-chain flow backing the move?
- Risk: Do you know your stop and position size before entry?
Key Takeaways
Technical analysis crypto works best when price structure, indicator confluence, and volume or on-chain confirmation all point the same direction before you risk capital.
| Point | Details |
|---|---|
| Use zones, not lines | Draw support and resistance as bands from clustered pivots, then confirm with volume profile. |
| Limit your indicator count | Combine 3 to 4 non-overlapping tools covering trend, momentum, volatility, and volume. |
| Confirm every breakout | Require volume or order-book/liquidation data before trusting a retest or breakout. |
| Size risk before entry | Risk 1% to 2% per trade and set ATR or structure-based stops, not fixed percentages. |
| Track live analysis | Blockchainreporter publishes real-time price data and trade-level writeups to cross-check your own setups. |
Table of Contents
- What Is Technical Analysis for Crypto, Exactly?
- Which Chart Types and Timeframes Work Best for Crypto?
- Which Indicators Actually Matter for Crypto Trading?
- How Do Support, Resistance, and Chart Patterns Work in Crypto?
- How Should You Size Positions and Set Stops in Crypto?
- What Are the Best Tools for Crypto Chart Analysis?
- How Do You Set Up a Crypto Trade Step by Step?
- What Mistakes Wreck Most Crypto TA Setups?
- What Does Order Book and Depth Analysis Tell You?
- How Do Sentiment and News Move Technical Patterns?
- What Are the Real Limits of Technical Analysis in Crypto?
- How I Apply Confluence When Reading Crypto Charts
- Follow Live Crypto Analysis From Blockchainreporter
- Frequently Asked Questions About Technical Analysis Crypto
- Sources
What Is Technical Analysis for Crypto, Exactly?
Technical analysis is the practice of studying price and volume history to forecast likely future moves, rather than researching a project’s team or tokenomics. That distinction matters more in crypto than in stocks, where fundamental analysis and technical analysis often get treated as competing camps instead of complementary tools.
Crypto markets trade 24/7 with no closing bell, liquidity splits across dozens of exchanges instead of consolidating on one, and leverage-driven liquidations can whip price through a level that would hold firm on a stock chart. That combination makes weekly closes and multi-timeframe checks carry more weight than they would for an equity trader.
- No session close means gaps behave differently than on Wall Street charts.
- Fragmented order books mean the same “support level” can look solid on one exchange and paper thin on another.
- Cascading liquidations can produce wicks that break textbook indicator rules.
Which Chart Types and Timeframes Work Best for Crypto?
Candlestick charts remain the default because they show open, high, low, and close at a glance. Heikin Ashi smooths noise for trend-following styles, and range bars filter out time entirely, plotting only price movement, which some scalpers prefer during choppy sessions.
- Candlesticks: best all-purpose choice, works for every style.
- Heikin Ashi: useful when you want to filter chop and stay in trends longer.
- Range bars: niche tool for pure price-action scalping.
| Trading Style | Typical Timeframe |
|---|---|
| Scalping | 1 minute to 15 minutes |
| Swing trading | 1 hour to 4 hours |
| Position trading | Daily to weekly |
Pro Tip: Check the 4 hour and daily charts together before entering. If they disagree on direction, treat any lower timeframe signal as noise until they line up.
Which Indicators Actually Matter for Crypto Trading?
Indicators fall into four functions, and mixing all four beats stacking five versions of the same thing. Trend tools like the 50 and 200 exponential moving averages tell you direction. Momentum tools like RSI and MACD tell you whether that direction is losing steam. Volatility tools like Bollinger Bands and ATR tell you how much room price needs to breathe. Volume tools like OBV and volume profile (VPVR) tell you whether real participation backs the move. This is roughly the practical indicator set most experienced crypto analysts default to.
Most indicators are lagging, meaning they confirm what already happened rather than predicting what comes next. RSI and MACD lean slightly more responsive, but no indicator sees the future. Piling on six or seven of them just multiplies conflicting signals instead of adding clarity.
Two example setups:
- Swing setup: 50/200 EMA for trend, RSI for momentum, OBV for volume confirmation. Enter only when all three agree on direction.
- Breakout setup: Bollinger Band squeeze for volatility compression, MACD cross for trigger, volume spike for confirmation. Skip the trade if volume stays flat on the breakout candle.
Pro Tip: Crypto’s wider daily swings mean standard RSI thresholds of 30/70 often trigger too early. Many traders widen them to 20/80 to avoid getting stopped out during strong trending moves.
How Do Support, Resistance, and Chart Patterns Work in Crypto?
Draw zones, not lines. A few-percent-wide band built from clustered wicks and bodies reflects how price actually reacts far better than a single pixel-thin line, especially once you check it against volume profile’s point of control.
Classic patterns still show up constantly: ascending and descending triangles before breakouts, head-and-shoulders topping formations, double tops and bottoms at range extremes, and bull or bear flags during trend pauses. The mechanics don’t change from stocks to crypto. What changes is confirmation.
When a support zone breaks on strong volume, it frequently flips into resistance on the retest, a role-reversal pattern that underpins most breakout-and-retest strategies. A false break, by contrast, often shows weak volume and gets reclaimed within a few candles.
Bitcoin’s $63,000 zone has behaved exactly this way in recent cycles, acting as a magnet where both retail and whale activity cluster. Beyond the chart, liquidation heatmaps and perpetual order-book walls often reveal hidden support and resistance that price action alone misses.
Pro Tip: Never trust a retest without checking volume or open interest. A retest on shrinking volume is far more likely to fail than one backed by fresh participation.
How Should You Size Positions and Set Stops in Crypto?
Stop placement tied to structure or ATR beats an arbitrary fixed percentage. Place stops below the actual invalidation point of your setup, whether that’s a recent swing low or a multiple of ATR, not at a round number that ignores what the chart is telling you.
- Risk a fixed percentage per trade, not a fixed dollar amount.
- Use ATR-based or structural stops instead of arbitrary percentages.
- Reduce size, not just leverage, when volatility spikes.
Leverage multiplies both gains and liquidation risk, and low realized volatility doesn’t mean low risk when funding rates and open interest are stretched. Rising open interest paired with a crowded funding rate is a classic setup for a violent liquidation cascade in either direction. Treat it as a warning signal, not background noise.
What Are the Best Tools for Crypto Chart Analysis?
Effective crypto TA needs a platform that combines interactive charting with volume profile, order-book depth, and ideally on-chain or liquidation data layered on top.
TradingView remains the standard for interactive charting, with real-time price data and a summary indicators panel that aggregates dozens of signals into one directional read. Investtech takes a different approach, publishing per-asset writeups with technical commentary that’s useful for cross-checking your own analysis against an independent view. Shrimpy Academy focuses on education, walking newer traders through indicator mechanics and chart pattern recognition before they risk real capital.
- Interactive charts with custom indicator support.
- Volume profile and order-book heatmap overlays.
- On-chain dashboards for exchange flow and whale activity.
Practice on a demo or sandbox account before committing real funds. Running the same setup fifty times on paper reveals whether your rules actually work before a single dollar is at stake.
How Do You Set Up a Crypto Trade Step by Step?
- Identify market structure. Determine if price is trending, ranging, or reversing on your chosen timeframe.
- Mark zones and levels. Draw support and resistance zones from clustered pivots, not single wicks.
- Confirm with indicators. Check that trend, momentum, and volume line up before acting.
- Define entry, stop, and target. Set all three before you click buy, not after.
- Size the position. Calculate size from your risk percentage and stop distance.
- Record the trade. Log entry logic, outcome, and what you’d change.
A mini example: price approaches a $63,000 zone on Bitcoin’s daily chart, RSI shows bullish divergence, and volume ticks up on the bounce. Entry sits just above the zone, stop goes below the recent swing low, and the target sits at the next resistance cluster. The trade gets logged either way, win or lose.
What Mistakes Wreck Most Crypto TA Setups?
Indicator stacking is the most common trap. Piling on RSI, Stochastic, and CCI at once just triples the noise since they measure similar momentum. Drawing support lines after price already bounced (hindsight bias) and ignoring exchange fees or slippage on tight setups are close behind.
- Too many indicators measuring the same thing.
- Drawing zones with 20/20 hindsight instead of a declared rule.
- Ignoring fees and slippage on high-frequency setups.
Confirm every signal with volume, multi-timeframe agreement, and order-book context before entering.
Pro Tip: Backtest a small, fixed rule set on historical data before trading it live, and resist the urge to tweak parameters mid-test. Changing rules after seeing results is how traders fool themselves into thinking a strategy works.
What Does Order Book and Depth Analysis Tell You?
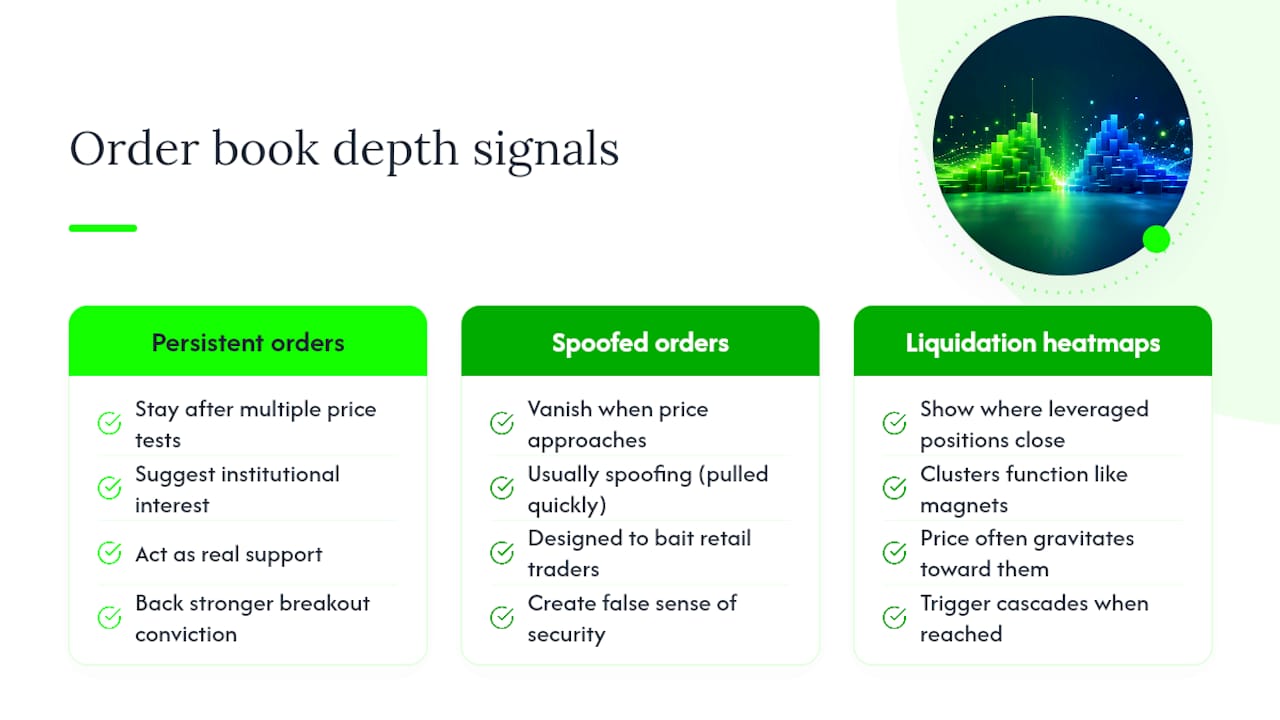
The order book shows every resting buy and sell order at each price level, and depth analysis reads how thick or thin those walls are. A large cluster of buy orders sitting just below current price can act as real support, but only if those orders are genuine rather than spoofed and pulled the moment price approaches.
Tools that display order book depth and liquidation heatmaps give context that a candlestick chart alone can’t show. Persistent limit orders that stay in place across multiple price tests suggest real institutional interest. Orders that vanish the instant price gets close are usually spoofing, designed to bait retail traders into a false sense of security.
Liquidation heatmaps add another layer, showing where leveraged positions would get forcibly closed if price reaches certain levels. Those clusters function like magnets. Price often gravitates toward zones with heavy liquidation density because market makers and larger traders have an incentive to push price there and trigger the cascade.
Reading depth alongside your indicator setup changes how you interpret a breakout. A breakout through resistance that’s also chewing through a thin, spoofed order book carries far less conviction than one grinding through a thick, persistent wall of real buy orders. Depth analysis won’t replace your chart work, but it tells you whether the level you’re watching is backed by real conviction or paper-thin liquidity that could evaporate the moment volume shows up.
How Do Sentiment and News Move Technical Patterns?
News and sentiment don’t override technical structure so much as they accelerate or invalidate it within minutes. A clean ascending triangle can break perfectly on schedule, or it can get blown apart entirely by a macro headline that has nothing to do with the chart itself.
Large sell orders from major holders illustrate this well. When fear grips sentiment after a large BTC sale, technical support levels that looked solid an hour earlier can give way instantly as panic selling overwhelms the order book. The chart pattern didn’t fail. The news changed who was willing to defend that level.
Macro data releases carry similar weight. CPI prints and forex cross-currents regularly move Bitcoin and altcoins hard enough to invalidate a setup that looked technically sound the day before. The same goes for large unlocks or macro liquidity events, like traders watching Bitcoin hold above $64,000 around a major share unlock , where a single headline shifted positioning across the entire market.
The practical takeaway: check the news calendar before trusting a pattern near a major economic release, and widen your stop or sit out entirely if a headline-heavy event sits directly in your trade’s path. A perfect chart setup means very little if a scheduled catalyst is about to override it.
What Are the Real Limits of Technical Analysis in Crypto?
Technical analysis describes probability, not certainty, and crypto’s structural quirks stretch that gap wider than in traditional markets. Thin liquidity on smaller-cap tokens means a single large order can invalidate a pattern that would hold on a deeper market. What looks like a clean breakout on a $50 million market cap altcoin might just be one wallet moving size.
Fragmented liquidity across dozens of exchanges means the same asset can show conflicting signals depending on which venue’s data feeds your chart. A support zone that holds on one exchange’s order book might already be broken on another, and retail-facing charting tools don’t always reconcile that difference for you.
Leverage compounds the problem. Cascading liquidations can produce price wicks that violate every rule in the technical playbook, not because the analysis was wrong, but because forced selling doesn’t care about chart structure. And unlike equities, crypto has no earnings reports or regulatory filing calendar to anchor fundamental catalysts, so sentiment and speculation carry disproportionate weight relative to the underlying technology’s actual progress.
None of this makes technical analysis useless. It means treating every setup as a probability estimate that improves with confirmation layers like multi-layer confluence rather than a mechanical formula guaranteed to work. The traders who lose the most are usually the ones who forget that distinction.
How I Apply Confluence When Reading Crypto Charts
My rule is simple: cap it at four indicators, and never enter without volume or on-chain flow backing the signal. A perfect-looking triangle breakout with no volume behind it gets ignored, full stop. Start the same way. Pick three tools that measure different things, write down your entry rule before you look at the chart, and let the market prove you right instead of talking yourself into a trade.
Follow Live Crypto Analysis From Blockchainreporter
Reading charts is only half the job. You also need to know what’s moving the market in real time, which is where most self-taught traders fall behind. Blockchainreporter tracks live price action alongside the news and macro events that actually move crypto technical patterns, from exchange outflow spikes to whale accumulation zones, so you’re not analyzing a chart in a vacuum.
If you want a live example of zone analysis in action, the ongoing coverage of Bitcoin’s key battleground levels shows exactly how role reversal and whale accumulation play out on a real chart, not a textbook diagram. Follow Blockchainreporter’s market analysis hub for regular technical writeups and price updates as new setups develop, and start cross-checking your own chart reads against live market commentary today.
Frequently Asked Questions About Technical Analysis Crypto
Is technical analysis reliable for crypto trading?
It improves your odds when combined with volume and confirmation signals, but no method guarantees results in a market this volatile. Treat every setup as a probability, not a certainty.
What’s the best timeframe for crypto technical analysis?
It depends on your style. Scalpers work in 1 to 15 minute windows, swing traders favor 1 to 4 hour charts, and position traders lean on daily and weekly closes.
How many indicators should I use at once?
Three or four covering different functions, trend, momentum, volatility, and volume, works better than stacking five tools that all measure the same thing.
Do chart patterns actually work in crypto?
Yes, the same patterns from stocks (triangles, head-and-shoulders, flags) show up regularly, but confirmation through volume matters more given crypto’s thinner and more fragmented liquidity.
Can news override a technical setup?
Frequently. A clean chart pattern can break down instantly if a major headline, large sale, or macro data release shifts sentiment before your setup plays out.
This article is general information, not a substitute for advice from a qualified financial advisor. Consult a qualified financial professional about your own circumstances before acting on anything here.
Sources
- What are support and resistance in crypto — Trust Wallet Academy
- Crypto Technical Analysis: The Complete 2026 Guide (AI + On-Chain Framework) — CoinXSight
Recommended
- Crypto Market Today | Prices, Trends & Analysis
- CPI Data Still Moves Bitcoin And Altcoins As Forex Brokers Spotlight Macro Cross-Currents
- Bitcoin At $63,600 As US-Japan Yen Move Tests Carry-Trade Foundations
- Crypto News: Bitcoin, Ethereum & Price Data | BlockchainReporter