




The Crypto Fear & Greed Index is a single number between 0 and 100 that compresses the emotional state of the crypto market into one readable signal. Below 50, the market leans fearful. Above 50, it leans greedy. The closer the score is to either extreme, the more one-sided market sentiment has become — and those extremes are where the index earns its keep.
Two providers dominate: Alternative publishes the most widely cited version, built primarily around Bitcoin signals. CoinMarketCap (CMC) runs its own variant with broader asset coverage. Both draw from the same general family of inputs:
- Volatility — how sharply prices are swinging relative to recent averages
- Market momentum and volume — whether buying pressure is accelerating or fading
- Social media sentiment — the tone and volume of crypto conversation on platforms like X (formerly Twitter)
- Surveys — periodic polls of market participants (paused by some providers)
- Bitcoin dominance — BTC’s share of total crypto market cap
- Google Trends — search interest in crypto-related terms
The original Fear & Greed Index was built by CNN for traditional markets, using seven market indicators to compress investor emotion into one score. The crypto version adapted that framework for a market that moves faster, trades 24/7, and is far more sentiment-driven than equities.
Key Takeaways
The Crypto Fear & Greed Index is most useful at extremes, where it signals one-sided positioning — but it requires price, volume, and derivatives confirmation before driving any trading or investment decision.
| Point | Details |
|---|---|
| 0–100 scale, 50 is neutral | Below 50 signals fear; above 50 signals greed; extremes below 25 or above 75 carry the most signal. |
| Six blended inputs | Volatility and momentum each carry roughly 25% weight; social, surveys, dominance, and trends split the rest. |
| Same-day vs. next-day accuracy | Same-day direction agreement can be substantially higher than next-day predictability, which approaches random chance. |
| Bitcoin-centric by default | Alternative.me’s widely used model centers on BTC signals — apply with caution to altcoin portfolios. |
| Always confirm before acting | Require trend, volume, and derivatives alignment before treating any extreme reading as a trade signal. |
Table of Contents
- How is the crypto fear and greed index calculated?
- What do specific scores actually mean?
- How do you actually use the fear and greed index?
- How predictive is the index, really?
- Where can you find live and historical index data?
- What are the real limits of this index?
- A note from Blockchainreporter
- Sources
How is the crypto fear and greed index calculated?
Each input gets normalized to a 0–100 scale, then the components are blended using fixed weights to produce a composite score. The weights below reflect the breakdown Kraken documents in its explainer — a useful reference point, though providers do vary:
The volatility and momentum components carry the most weight because they reflect actual market behavior rather than stated opinion. High volatility relative to recent history pushes the score toward fear; strong buying momentum relative to baseline pushes it toward greed.
Moving averages matter here. Most providers use 30-day and 90-day lookback windows to normalize each component, which means the index reflects a rolling picture of sentiment rather than a single day’s spike. A one-day crash won’t necessarily crater the score if the prior 30 days were calm.
Pro Tip: Before applying any index reading to an altcoin-heavy portfolio, check whether the provider is Bitcoin-centric. Alternative.me’s model relies heavily on BTC inputs — volatility, momentum, dominance, and Google Trends — so a score of 20 during a Bitcoin selloff may not reflect what’s happening in mid-cap DeFi tokens at all.
Survey data is worth flagging separately. Some providers have paused their polling components, which shifts more weight onto the remaining signals. Always check the provider’s current methodology page before assuming the weights above apply exactly.
What do specific scores actually mean?
The five standard bands cover the full 0–100 range:
- 0–24: Extreme Fear — Panic selling, capitulation, or a macro shock. Historically where contrarian buyers look hardest.
- 25–44: Fear — Bearish sentiment dominates. Buyers are cautious; sellers are active.
- 45–55: Neutral — No strong directional signal. The market is roughly balanced between bulls and bears.
- 56–74: Greed — Optimism is running. Momentum is positive, but crowding risk is building.
- 75–100: Extreme Greed — Euphoria. Retail FOMO is typically elevated; risk of a sharp reversal is higher.
Readings near 50 are often the least useful. When the score sits between 45 and 55, the index is essentially saying the market is mixed — which you probably already knew. The signal sharpens at the extremes, where positioning becomes one-sided.
Two brief scenarios illustrate why context matters even within the same band:
-
Score of 12 with falling volume: Volume is drying up alongside the fear reading, suggesting genuine capitulation rather than a brief panic. Historically, low-volume extreme fear has preceded some of the stronger recovery rallies — but confirmation from price structure is still required before acting.
-
Score of 82 with parabolic volume: Greed is high and buying volume is surging. This combination has often preceded sharp corrections, because it signals that late buyers are piling in at elevated prices. CryptoSlate notes the index is most useful at these extreme readings precisely because they signal one-sided positioning.
A score of 82 on low volume tells a different story — it may reflect thin, illiquid optimism rather than a crowded top. Same number, different risk profile.
How do you actually use the fear and greed index?
The index works best as a filter, not a trigger. Here’s how to apply it across different use cases.
Common applications:
- Contrarian entry signal: Extreme fear readings have historically appeared near market lows, making them a prompt to look for entry setups — not to buy blindly, but to start watching more closely.
- Exposure trimming: Extreme greed readings are a prompt to review position sizes, tighten stops, or take partial profits — again, not a sell signal on its own.
- Emotional sanity check: If you feel the urge to buy aggressively when the score is 85, the index is telling you the crowd already agrees with you. That’s worth pausing over.
Step-by-step decision rules for short-term traders:
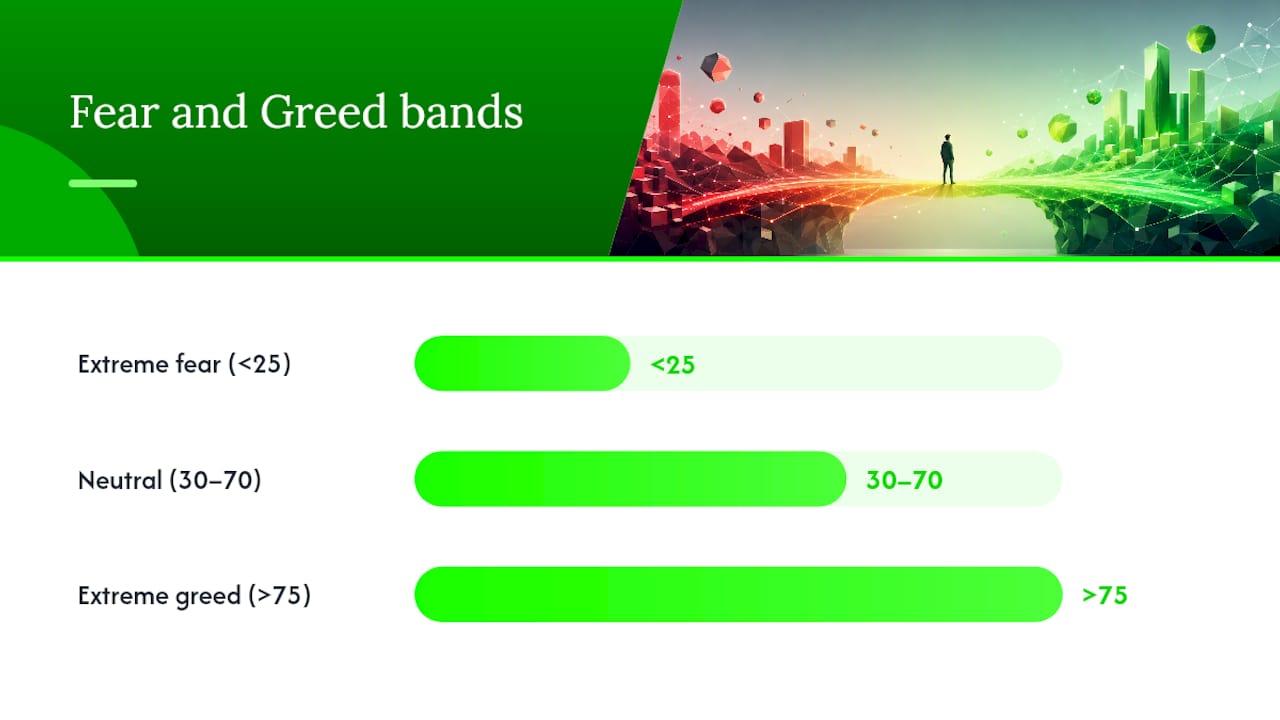
- Check the current index score and note whether it’s in an extreme band (below 25 or above 75).
- Confirm the price trend direction using a simple tool like a 20-day moving average or recent higher-highs/lower-lows structure.
- Check spot volume — is it expanding or contracting relative to the prior week?
- Look at derivatives data: funding rates and open interest on perpetual futures tell you whether leveraged traders are positioned in the same direction as the sentiment reading.
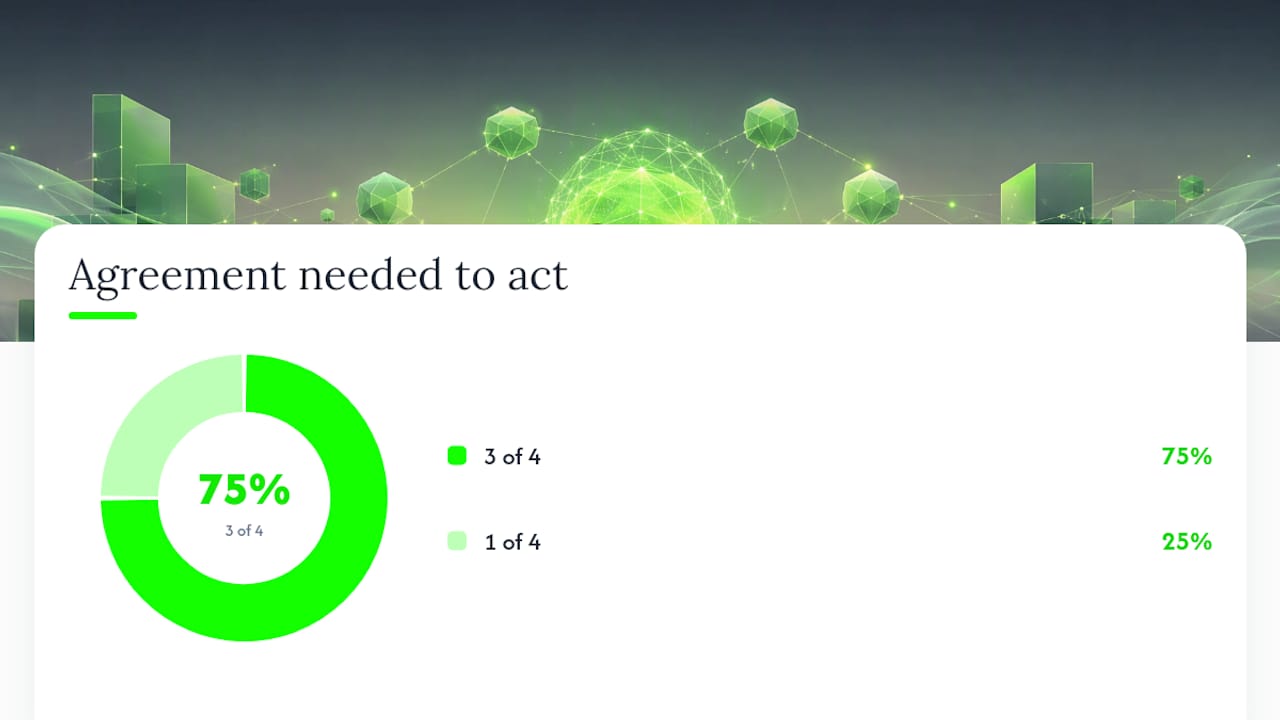
- Only act if at least two of the three confirmations (trend, volume, derivatives) align with the index signal.
For longer-term investors, the rules simplify:
- Use extreme fear readings (below 25) as a prompt to dollar-cost average or add to core positions — not to time a single entry.
- Use extreme greed readings (above 75) as a prompt to rebalance toward target allocations, not to exit entirely.
- Ignore readings between 30 and 70 for portfolio-level decisions.
A real-world case: when historic fear gripped Bitcoin sentiment following a large on-chain BTC sale, the index dropped sharply. Traders who waited for price stabilization and volume confirmation before acting fared better than those who bought the fear reading alone.
How predictive is the index, really?
The honest answer: better at describing the present than predicting the future.
CFGI’s observations show that the index can agree with same-day market direction at a substantially higher rate than it predicts next-day moves — with same-day agreement around 79% in their data versus next-day predictability closer to 49%, which is near-random. That gap is the key insight. The index reflects current sentiment well. It does not reliably forecast what happens tomorrow.
Several structural limitations explain the predictive ceiling:
- Bitcoin dominance bias: Providers like Alternative.me weight BTC signals heavily. During altcoin-led rallies or sector rotations, the index can read fear while specific assets are surging.
- Social media noise: Engagement metrics on X and Reddit can be gamed or distorted by coordinated campaigns, inflating the social component.
- Survey gaps: When providers pause polling, the remaining components carry more weight than the published methodology implies.
- Prolonged extremes: During strong bull or bear trends, the index can stay in extreme territory for weeks. A score of 80 in month one of a bull run looks different from a score of 80 in month twelve.
Backtests also carry methodological risks. Lookahead bias — where a researcher selects the time windows that make the signal look good — is common in sentiment studies. Sample selection matters too: a backtest covering only 2020–2021 will show strong contrarian returns because that period had sharp V-shaped recoveries. A backtest including 2018 or 2022 tells a harder story.
Macro events can also override sentiment entirely. CPI releases and other macro data points have moved Bitcoin and altcoins sharply regardless of where the index sat beforehand.
Where can you find live and historical index data?
Two providers are the practical starting points for most readers.
Alternative.me publishes a daily Crypto Fear & Greed Index at its dedicated page, with a full historical chart going back several years and a public API that returns current and historical scores in JSON format. The data is free, no authentication required for basic queries.
CoinMarketCap runs its own CMC Crypto Fear and Greed Index, visible on its market overview pages. CMC’s version incorporates a broader asset universe than Alternative.me’s Bitcoin-centric model, which can produce different readings on the same day.
CFGI (cfgi.io) takes a different approach entirely: per-asset scoring across many individual cryptocurrencies, updated more frequently than daily. If you’re managing a multi-asset portfolio, per-asset scores reveal divergences that a market-average number hides.
Steps to pull data via API (general approach, no credentials needed for Alternative.me’s public endpoint):
- Send a GET request to the provider’s API endpoint (Alternative.me’s is publicly documented on its index page).
-
Specify the
limitparameter to retrieve historical records — up to several hundred days of daily scores are available. -
Parse the returned JSON for the
value(score) andvalue_classification(band label) fields. -
Verify the
timestampfield before using the data — some aggregators cache scores and may display a reading that’s hours old.
CryptoSlate notes that update frequency varies by provider: Alternative.me publishes once daily, while some platforms update multiple times per day. Always check the timestamp on any score you’re acting on, especially during fast-moving markets where sentiment can shift within hours.
Historical CSV downloads are available from Alternative.me directly. For programmatic access to longer time series, the API with a high
limit
value is the cleaner option.
What are the real limits of this index?
The index is a useful tool with a specific job. Outside that job, it misleads more than it helps.
Core limitations:
- Low short-term predictive power — next-day direction is close to random based on available observations
- Bitcoin-centric design skews readings during altcoin-led market moves
- Social media inputs are vulnerable to manipulation and coordinated noise
- Survey components have been paused by some providers, silently shifting weights
- Mid-range readings (roughly 30–70) carry little actionable signal
- Prolonged trends can keep the index in extreme territory, making contrarian signals premature
Confirmation checklist before acting on an extreme reading:
- Is the price trend aligned with the sentiment signal (downtrend during extreme fear, uptrend during extreme greed)?
- Is spot volume expanding or contracting — and in which direction?
- What are perpetual futures funding rates showing? Negative funding during extreme fear strengthens the contrarian case.
- Are on-chain metrics (exchange inflows/outflows, large-holder behavior) consistent with the sentiment reading? Tools like blockchain explorers let you verify on-chain signals directly.
- Is there a macro event (Fed decision, CPI print, regulatory news) scheduled that could override sentiment entirely?
Pro Tip: Set a personal rule: never act on a fear or greed reading alone. Write down the index score, the price trend, the volume reading, and the funding rate before making any decision. If three of the four align, the signal is worth taking seriously. If only one does, it’s noise.
The index is a crowd-behavior snapshot, not a market oracle. Used as a filter alongside liquidity, derivatives, and on-chain data, it adds genuine context. Used as a standalone buy/sell trigger, it produces the kind of false confidence that tends to be most expensive at exactly the wrong moments.
A note from Blockchainreporter
At Blockchainreporter, tracking sentiment alongside price data is part of how we cover crypto markets daily. The Fear & Greed Index appears regularly in our live market coverage because it gives readers a fast read on crowd psychology at any given moment — not as a prediction, but as context for the price action we’re reporting. When the index hits extremes, our coverage tends to dig deeper: what’s driving the fear or greed, whether on-chain data confirms it, and what historical analogs look like. That combination of sentiment context and hard data is what separates useful market analysis from noise.
Stay current on crypto sentiment and market moves at Blockchainreporter — live price data, expert analysis, and breaking news updated throughout the day.
Sources
- Alternative
- Crypto Fear and Greed Index, explained | Kraken
- Crypto Fear and Greed Index: What Is It and How Does It Work? | CryptoSlate
- What is the Fear and Greed Index? How It Works | CFGI Learn
- How CNN’s Fear & Greed Index Impacts Investor Sentiment
This article is general information, not a substitute for advice from a qualified financial advisor. Consult a qualified financial professional about your own circumstances before acting on anything here.
Recommended
- Crypto Market Today | Prices, Trends & Analysis
- Historic Fear Grips Bitcoin Sentiment After 1,638 BTC Sale
- Crypto News: Bitcoin, Ethereum & Price Data | BlockchainReporter
- Bitcoin ETFs Post $11.6 Million Outflow As Ether Funds Add $9.2 Million