The post Solana Price Prediction: TD Sequential Signals Potential SOL Breakout appeared first on Coinpedia Fintech News
Solana is beginning to flash signals that traders rarely ignore. While the broader crypto market remains uncertain, SOL is quietly building a case for a potential breakout. A key technical indicator has flipped bullish, just as on-chain data shows Solana tightening its grip over one of crypto’s fastest-growing sectors, real-world asset (RWA) tokenization.
This convergence of technical reversal signals and strong network activity often emerges before major moves. With momentum starting to shift, the question now is: Is Solana price about to skyrocket?
TD Sequential Signals Potential Reversal
Recent chart data shows the TD Sequential indicator printing a buy signal on the 4-hour timeframe, a pattern commonly associated with exhaustion in downtrends. This signal typically appears when selling pressure begins to fade, suggesting that bears may be losing control.
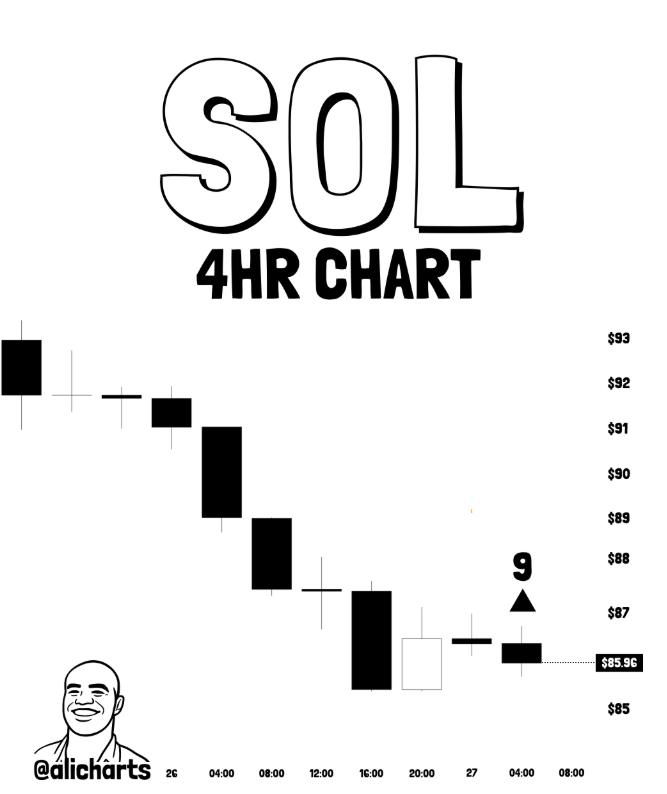
While it does not guarantee an immediate rally, it often acts as an early indication that a short-term reversal could be forming. In the current setup, the signal aligns with stabilizing price action, increasing the probability that SOL may be transitioning from a corrective phase into an early recovery stage.
Solana Strengthens Its Position in RWA Market
Beyond technical signals, Solana’s fundamental growth is strengthening its market position. Recent data indicates that the network accounts for nearly 98% of all tokenized on-chain spot equity volume, placing it at the center of the rapidly expanding RWA narrative. This level of dominance reflects increasing adoption and confidence in Solana’s infrastructure for real-world financial applications.
— BSCN (@BSCNews) March 27, 2026
BIG DATA: SOLANA DOMINATES IN RWA AND TOKENIZATION $SOL has established itself as the dominant L1 force when it comes to tokenization and RWAs, accounting for some 98% of all tokenized onchain spot equity volume over the past week (per TokensOnSolana).
It is also reported… pic.twitter.com/pS9Qgr7r7w
In addition, the network processed approximately 826 million transactions within a single week, representing a significant share of overall blockchain activity. Such sustained throughput highlights strong user engagement and reinforces Solana’s role as a high-performance ecosystem. Together, these metrics point toward real demand rather than speculative interest, a key factor that often supports long-term price strength.
Historical Pattern: The Signal That Preceded Every Major Solana Rally
A deeper look into Solana’s historical price behavior reveals a recurring pattern that traders are beginning to monitor again, the formation of a monthly bullish engulfing candle.
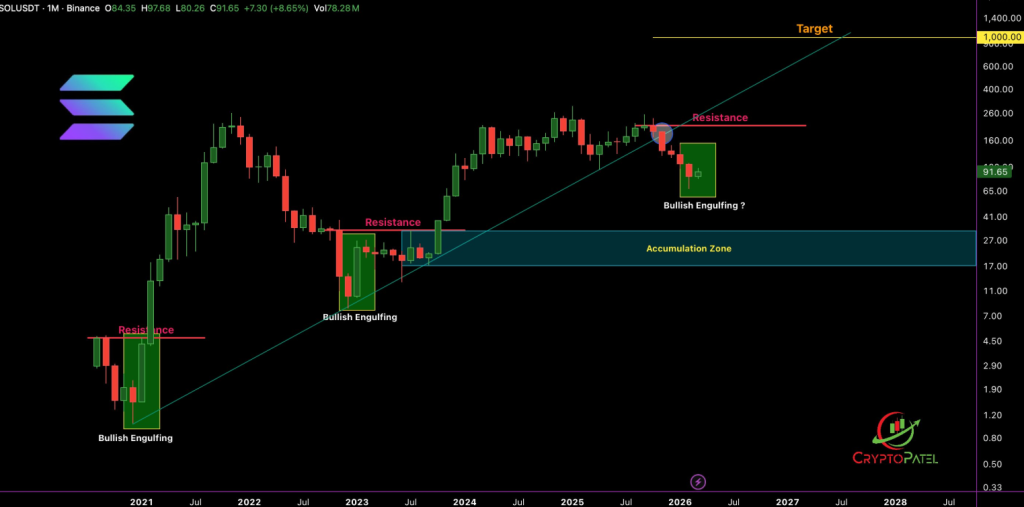
In previous market cycles, this single signal has consistently preceded major upside expansions. Each time Solana printed a strong bullish engulfing structure on the monthly timeframe, it marked the beginning of a sustained rally phase.
Conversely, periods lacking this confirmation have struggled to generate meaningful upward momentum. This reinforces the importance of the pattern as a macro-level trigger, rather than just a short-term signal. At present, Solana has yet to fully confirm this structure. However, the developing setup is drawing attention, as a confirmed engulfing candle could signal a broader trend reversal and potentially unlock stronger upside momentum.
Key Levels to Watch
In the near term, maintaining support around the current consolidation zone around $75-$80, will be crucial for sustaining bullish momentum. A breakdown below this level could delay recovery and reintroduce downside risk toward $70. On the upside, the first major resistance lies near recent rejection levels around $90-$95. A breakout above this zone would act as confirmation of strength and could accelerate price toward higher levels toward $110-$120, aligning with the broader bullish signals seen across both technical and on-chain data.
Outlook: Can Solana Lead the Next Market Move?
Solana’s current setup reflects a strong alignment of technical indicators, network growth, and sector dominance. While macro conditions remain a key variable, SOL is beginning to show relative strength compared to the broader market. If momentum continues to build and resistance levels are cleared, Solana could transition into a high-momentum recovery phase, potentially positioning itself as a leader in the next market cycle.