The significant decline in Bitcoin has highlighted an increasing conflict within the crypto markets, with experienced investors who typically seize opportunities during dips facing rising indications of underlying weaknesses.
Is it caution, opportunity or structural vulnerability for having run up too far too fast?
That is the dilemma for investors who are now seeing a clear clash between conviction and market risk.
The recent sell-off may be more of a profit-taking move than an indication of long-term market expansion, according to some experts.
They advise taking it slow because new capital isn't flowing into the market, and Realised Cap, a measure of coin value based on its last transaction price, hasn't moved.
The decline in Bitcoin is indicative of a wider correction across various asset classes.
According to analysts, the decline began with small-cap companies and the US dollar, then spread to equities and precious metals, before impacting the highly leveraged cryptocurrency markets.
Even with these negative signals, certain quantitative assessments suggest that Bitcoin may be priced lower than its historical value.
A recent power-law model indicates that Bitcoin is currently trading 35% below its 15-year trend, positioning it in a historically "oversold" area that often correlates with significant average-reversion trades.
The returns for the following 12 months might potentially approach 100%, according to the power-law model. It projects that by the middle of 2026, Bitcoin's value would reach $113,000, and by the beginning of 2027, it might surpass $160,000.
Still, the recent sell-off highlights a more profound structural insight. Analysts highlighted that markets continually challenge focus and belief, with the current trading pattern questioning investor bets.
When market movements rely on ongoing purchases by a limited number of players, any deceleration reveals vulnerabilities.
A reliance on concentrated capital can increase volatility when those inflows stop, as seen by historical events like the Terra/LUNA disaster and Strategy's Bitcoin investments.
There appear to be two competing influences on the Bitcoin market as it strives for stability: the will of investors capitalizing on falling prices and the hidden pressures caused by a lack of fresh capital and leveraged holdings.
New Week, Same Show?
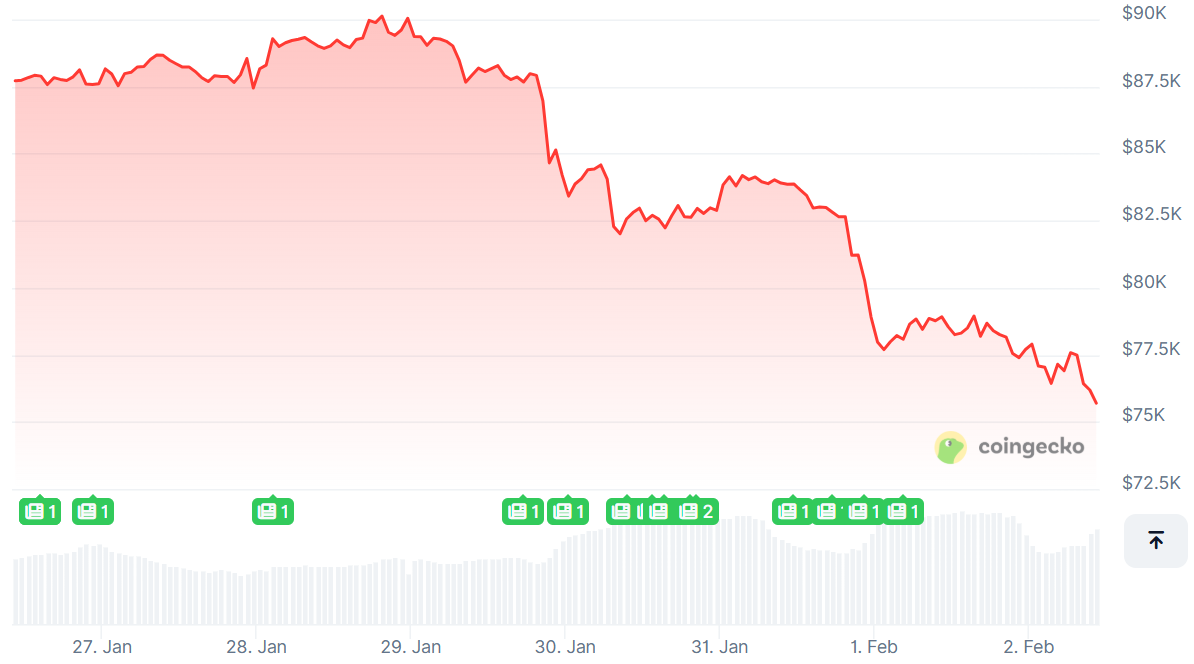
At the start of the trading week, Bitcoin was priced just above $76,000, having dipped below $75,000 during a thin-trading weekend.
This brings to mind the levels that were observed last year following US President Donald Trump's "Liberation Day" tariffs in April.
The price of Bitcoin has seen a downturn, driven by the liquidation of nearly $5 billion in leveraged positions over the last three days, leading to heightened selling pressure.
Decreased interest from major investors and limited purchasing support have resulted in a decline in Bitcoin, accompanied by forced liquidations in a market characterized by reduced liquidity over the weekend.
Bitcoin's price has dropped significantly from its all-time high of $126,300, and it is now trading at $76,564, breaking below the important support level of $80,000 for the first time in several months.
After Friday's metals shock, traders in Asia were more cautious ahead of a busy schedule, sending share prices in the region down along with Wall Street futures.
The sentiment remained jittery in the commodities market.
Silver continued its decline, dropping an additional 5% at one point, following Friday’s significant 30% plunge that pressured leveraged positions in what had turned into a saturated market.
Gold continued to face challenges following a significant drop on Friday, which represented its largest daily decline since 1983, while silver experienced its most substantial single-day loss ever recorded.
Currency fluctuations introduced an additional dimension.
The dollar remained strong following Trump's nomination of Kevin Warsh as the next chair of the Federal Reserve, a choice that the markets interpreted as possibly less accommodating to swift rate reductions and more focused on the Fed's balance sheet management.
$80K or $70k, Which is More Likely?
The price of Bitcoin has begun a significant downturn after falling below the $80,000 mark. The price of BTC has declined by more than 10% in the past three days and some analysts say it could potentially approach the $70,000 support level.
A low was established around $75,500, and the price continues to indicate potential further declines. A bearish trend line is emerging, presenting resistance at $79,200 on the hourly chart for the BTC/USD pair.
With a price below $78,500, Bitcoin has fallen below the 100 hourly simple moving average. It may start a fresh rising trend if the price stays above $75,000.
Around $78,500 is the present level of resistance.
From the slide that began at the $90,440 high and proceeded down to the $75,665 trough, the initial important resistance is around the $79,200 mark, which corresponds to the 23.6% Fibonacci retracement level.
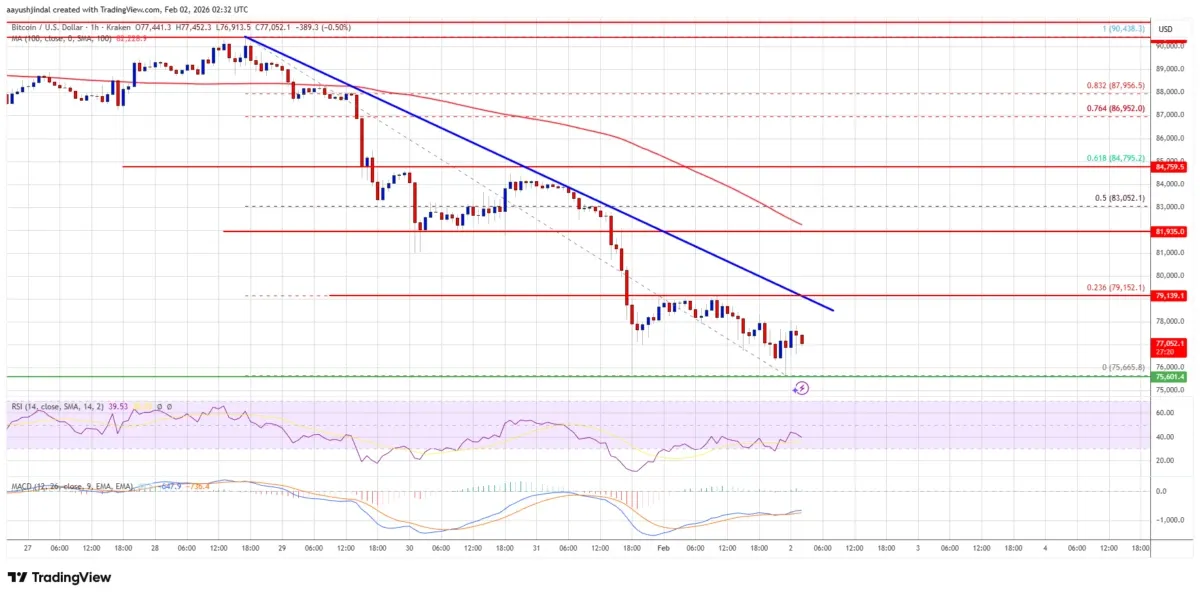
A breakthrough above the $79,200 resistance level could propel the price to new heights. In this scenario, the price has the potential to increase and challenge the $82,000 resistance level.
Further increases could propel the price towards the $83,000 mark or the 50% Fibonacci retracement level from the decline that came between the $90,440 peak and the $75,665 trough.
The upcoming resistance levels for the bulls may be at $84,000 and $84,500. Bitcoin can start a new decline if it doesn't break over the $79,200 barrier.
Around the $76,200 level, you can find current support. Around the $75,500 area is where you'll initially see considerable support. At roughly the $75,000 level, we can see the next support level. The $72,000 support level may be reached in the near future if the price continues to fall.
If Bitcoin's price drops below $70,000, the main level of support, it could be difficult for the cryptocurrency to make a quick comeback.
What Do Other Technical Summaries Show?
TradingView's overall technical analysis based on key data from moving averages, oscillators, and pivots for the week ahead showed a sell signal, with both the short-term and long-term gauges pointing to negative readings.
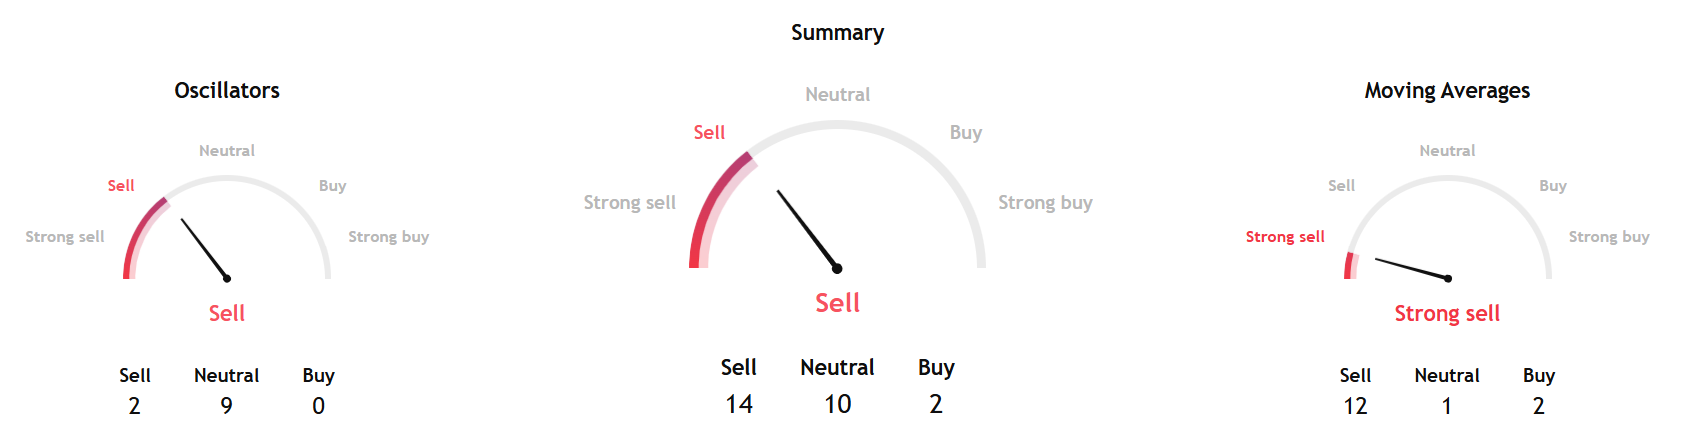
- The hourly MACD is currently picking up momentum within the bearish territory.
- The current hourly Relative Strength Index for BTC/USD has dipped below the 50 mark.
- Key Support Levels – $75,500, then $75,000.
- Key Resistance Points – $79,200 and $82,000.
Separately, InvestTech's Algorithmic Overall Analysis and the recommendation for one to six weeks was negative.
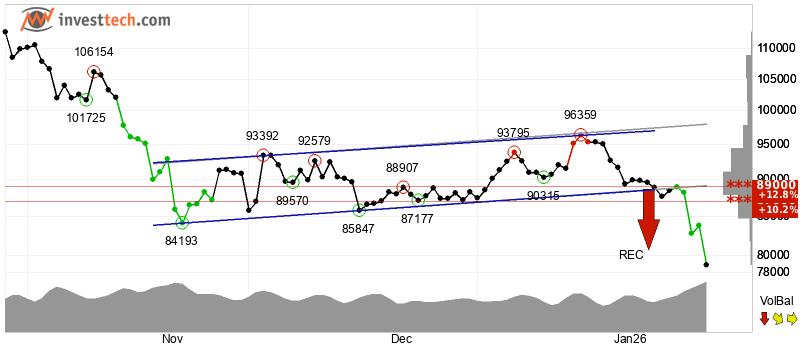
InvestTech said, "An approximate horizontal trend channel in the short term is broken down. A continued weak development is indicated, and the currency now meets resistance on possible reactions up towards the trend lines." The price has had a strong fall after the negative signal from the rectangle formation at the breakdown through the support at $88,604.
The research noted, "The objective at $80,705 is now met, but the formation signals further development in the same direction. There is no support in the price chart, and further decline is indicated."
InvestTech noted resistance at $87,000, and an RSI below 30 after the falling prices of the past weeks. "The token has strong negative momentum, and further decline is indicated. However, particularly in big stocks, a low RSI may be a sign that the stock is oversold and that there is a chance for a reaction upwards. The crypto is overall assessed as technically negative for the short term."
Blockcast – Licensed to Shill: What's in Store for 2026 – Stablecoins, the Future of DeFi.. and a Return of NFTs?
Licensed to Shill opens 2026 with a forward-looking conversation on the forces shaping the next phase of digital assets. Real-world assets, prediction markets, NFTs beyond the hype cycle, and the role of SMEs in pushing practical adoption all feature as the panel weighs what’s likely to matter – and what’s likely to fade – in 2026.
Thanks for tuning in! If you enjoyed this episode, please like and subscribe to Blockcast on your favorite podcast platforms like Spotify and Apple .
Be at the heart of TradFi–DeFi collaboration at Money20/20 Asia 2026 .
Are you looking to forge partnerships with banks and fintechs? To expand into new markets across Asia, or to secure funding from top-tier investors? This April, the world of digital assets, blockchain, and Web3 converges with the biggest players in APAC’s financial ecosystem at Money20/20 Asia 2026 and its brand new ‘Intersection’ zone, complete with a dedicated content stage, TradFi-Defi innovator showcase, and curated networking spaces. From traditional banking giants to decentralised innovators, private equity leaders, and cutting-edge fintech disruptors, this is where they meet to forge partnerships, spark dialogue, and shape the future of finance.