Bitcoin Spot Demand Growing For First Time Since Early October: CryptoQuant Head


CryptoQuant’s head of research has revealed how the “Apparent Demand” metric is now showing growth for the first time in more than a month.
Bitcoin Apparent Demand Has Flipped Positive Recently
In a new post on X, Julio Moreno, head of research at on-chain analytics firm CryptoQuant, has talked about the latest trend in the Apparent Demand for Bitcoin. This metric measures, as its name suggests, the amount of spot demand that’s currently present for the cryptocurrency.
The indicator’s value is calculated by taking the difference between BTC’s production and changes in its inventory. “Production” here refers to the amount that miners are introducing into circulation each day. Similarly, the asset’s “inventory” is the amount stashed away in the 1-year inactive supply.
Now, here is the chart shared by Moreno that shows how the 30-day sum of the Apparent Demand has changed over the last few months:

As displayed in the above graph, the 30-day sum of the Bitcoin Apparent Demand fell into the negative territory last month, suggesting demand for the asset was decreasing.
Recently, however, the metric has witnessed a sharp surge back into the positive territory. Thus, it would appear that, for the first time since early October, demand for BTC is growing again.
While spot buying demand may be growing now, attention over in the perpetual futures market is down. As on-chain analytics firm Glassnode has pointed out in an X post , the Bitcoin Futures Open Interest has remained at low levels since last month’s leverage flush.

The Futures Open Interest here refers to an indicator that keeps track of the total amount of perpetual futures positions related to Bitcoin that are currently open on all centralized exchanges. From the chart, it’s visible this metric saw a huge plunge in October as the drawdown in the BTC price liquidated a large amount of positions.
The indicator has remained at its lows since this decline, indicating that there isn’t much speculative buildup happening in the market. “Derivatives activity has slowed materially, mirroring the broader backdrop of subdued market sentiment,” noted Glassnode.
Another side of the sector where demand has been weak is the US spot exchange-traded funds (ETFs) .

As the chart shared by Glassnode in a separate X post shows, the US Bitcoin spot ETFs have mostly seen outflows since early October. “This trend points to a broader de-risking phase among ETF investors,” explained the analytics firm.
BTC Price
Bitcoin has retraced some of its latest recovery as its price has come down to $103,200.


China’s Cybersecurity Agency Alleges US Government Stole $13 Billion In Bitcoin
According to a recent report by Bloomberg, the cybersecurity arm of China has openly accused the US ...
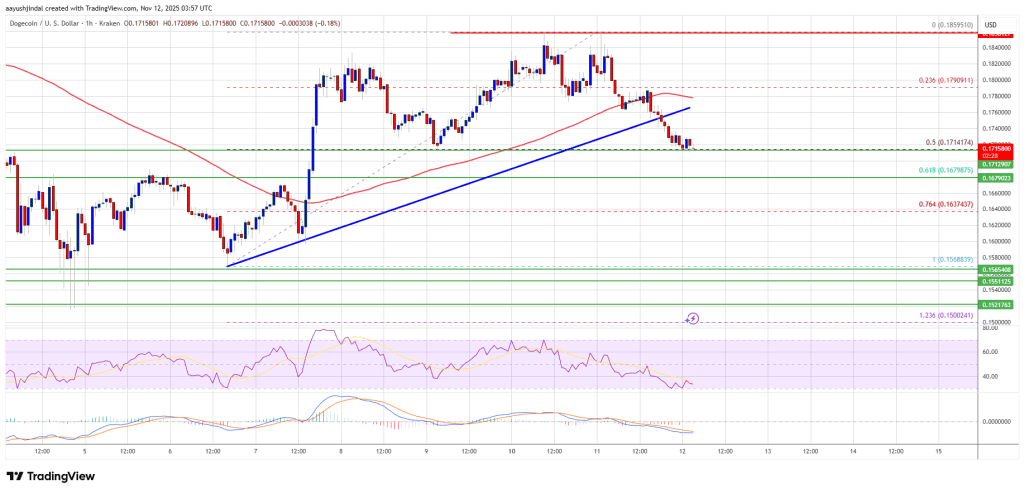
Dogecoin (DOGE) Falls Back Mildly — Support Just Below Could Trigger Fresh Upside
Dogecoin struggled to rise above $0.1850 and corrected some gains against the US Dollar. DOGE is now...

XRP ETF Canary Takes Flight: 8-A Filing Clears Path To Nasdaq Listing
Canary Capital filed formal paperwork on Monday that could let an XRP-backed ETF start trading on Na...